
Motivation
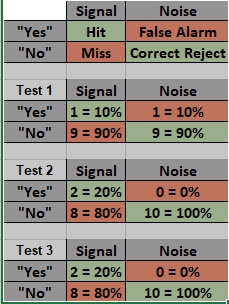
For this project, I will be designing and building a device to measure the signal detection performance of any user to demonstrate the concepts of Signal-Detection Theory (SDT). In summary, SDT is a general framework to evaluate an observer’s ability to detect the presence of a signal through a number of “YES/NO” trials. By recording an observers rate of “hits” (Subjects are right if they correctly detect a signal when it is present) or “correct reject” (Subjects are right if when the subjects correctly say the signal is absent). With these values obtained, we can populate the following Confusion matrix:

Hardware and Software build
I will be using an Arduino (Grove Beginner Kit) that contains various sensors that are pre-connected right out of the box and a USB-cable to connect the Arduino device to your PC; therefore, I did not need to any wiring or retrieve any additional hardware. A user will only need to download the Arduino IDE version (1.8.13) to run their code with assigned pins to inputs/outputs to utilize the sensors. For this project, an LED, button, potentiometer, and buzzer sensors are included with the Arduino board; therefore I decided to conduct an SDT experiment using light and sound and obtain the user’s input using the button sensor.
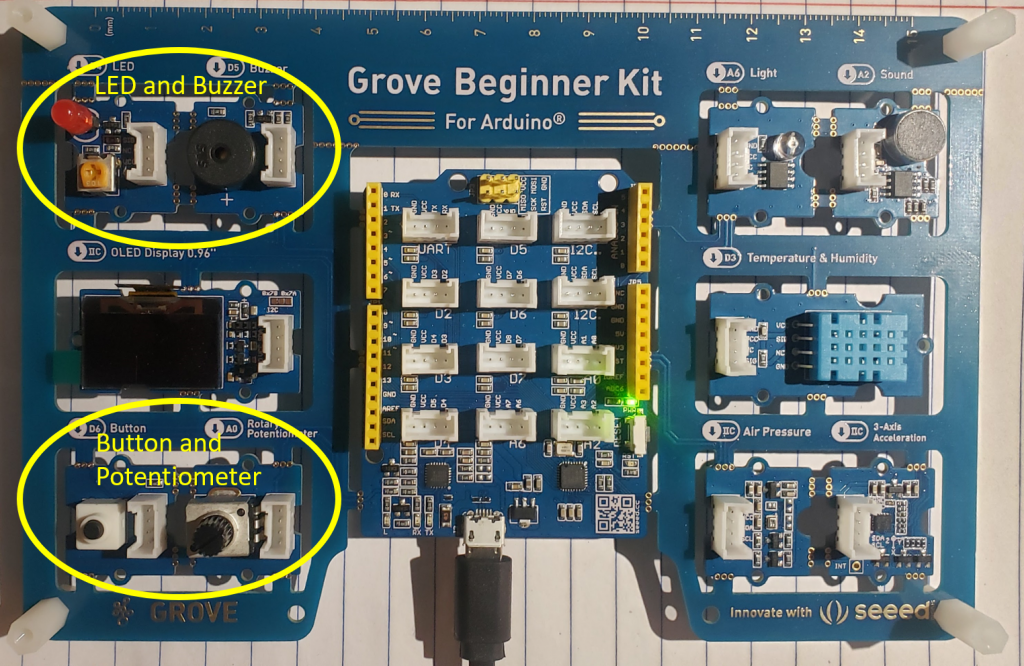
The first part of this project is to create a test device. The test will involve a user pressing the button only when they see the LED turn on AND if there is also a sound from the buzzer. The LED will turn on and off at a constant rate. The buzzer sound will randomly turn on or remain off for 1 second in duration at the same time the LED turns on. Before a user can take this test, we first need to determine the user’s hearing-threshold because ideally, the volume level of the buzzer needs to be roughly-close to their threshold, a level at which that can barely hear the sound. To accomplish this, we would have the user dial a potentiometer that controls the volume of a buzzer to the level at which they can barely hear the sound and hit the button sensor to record that value. They would perform this task again but starting the potentiometer from the opposite end. The recorded values are averaged, and the corresponding potentiometer value is mapped from the range of [0-255] (volume needs to be in bytes). You can create the same hearing-threshold setup by following these instructions.
The second part of the project is the actual setup of the test device. As stated above, my SDT test will involve the user pressing a button for every time they see the LED turn on as well as hear the buzzer. Important: The volume level recorded by the user from part 1 is used for the test. The score for the hits, correct rejections, miss, and false alarms will go as follows:
If the beeper is on and the button is pushed, you are in the hit rate zone
If the beeper is on and the button is not pushed, you are in the miss zone
If the beeper is off and the button is pushed, you are in the false alarm zone
If the beeper is off and the button is not pushed, you are in the correct reject zone
A counter of +1 will be added to each category that the user falls in. In addition to recording the results, I decided to display the results using p5.js, a library that enables the communication between a p5 sketch and serial enabled device (Arduino).
You can create the same test setup by following these instructions.
For the SDT test, I decided to set the total number of trials to 20 with an even split between present signals and absent signals. I used the random(min = 1,max = 3) function which generates a number between the lower bound value (min) and upper bound value but not inclusive (max).
Naive User Walkthrough
Record your Hearing-Threshold
Before you can take the signal test we first need to determine the lowest sound you can hear, otherwise known as your ‘hearing-threshold’ by hitting the bottom at the moment you can barely hear the buzzer from the device. We will do this 4 times, 2 when starting at max volume, and then decrease the sound by turning the knob which controls the volume, and another 2 starting at the lowest volume and increase the sound the same way. The values that you get once you complete this part are then averaged to get a single value that you will need in part two.
Signal Detection Theory Test
In part two, you will be taking the test which will consist of 20 trials. In each trial, the LED will blink red and a buzzer sound may or may not play. Your task will be to press the bottom only when both the LED and buzzer go off as best as you can. Remember, the volume of the buzzer will be set at your ‘hearing-threshold’ value. You will be asked to perform this task 3 times while the device will record your scores. After each test, you will see your score in the following format:

Data
With the test device now setup, I decided to be the first user. Below are the results of my session:
My average value from the hearing-threshold test was recorded at 2.0 bytes. With this value known, I updated the volume level variable for part 2. My 3 sessions are shown below:
With the given data, we can calculate sensitivity, d’, with the following equation:
d’ = z(hit) – z(false alarm),
where z(probability) is the z-score of the percentage of the hit and false alarm values.
We use the z-score to describe the position of a raw score in terms of its distance from the mean in units of standard deviation. Based on Test 1, d’ = 0, meaning that sensitivity is on the mean. Looking at the Test 1 Confusion matrix, we learned that the matrix resembles a pattern of “No Detection” due to reporting “yes” in 10% of the trials or reporting an equal amount of signals that are both present and absent. Test 2 and Test 3 resulted in a d’ = 1.484
One of the most valuable plots to generate when performing an SDT test is the Receiver operating characteristics (ROC) which is a plot of hit rate vs false alarm rate. The following figure shows the ROC from three of my sessions:
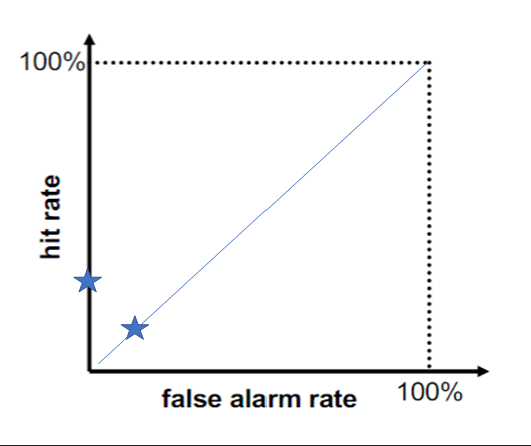
From the results of my three sessions, we can conclude that I would not be a strong observer for signal detection as my performance is distant from the ideal location on the hit rate vs. false-alarm rate which would be towards the upper left.
Conclusions and Future Directions
While performing each SDT session, I found it really difficult to get a hit as I was listening to the buzzer. One issue I did realize is that when running the programs on my laptop along with the device, my laptop’s fan began to run faster which could make hearing the buzzer more difficult which may impact the results of the test. Overall, SDT is a tool to evaluate the performance of an observer whether a person or a sensor, and try to gain insights into how to better design the system.
In a future direction, I would consider performing this same experiment with background noise removed or at least consistent for each trial.