Hello everyone! It’s been a bit since the last time I did an annual round-up of the data I have for the library, and I thought it was high time to do another one. Especially given how much things have changed these last few years. And what interesting changes!
First thing is first, of course: what were the fullest days in the library this past year? There are actually two answers! On both December 6th and April 4th we counted 950 people sitting in the library. 950! That’s nuts! A neat side fact: both of those days are Tuesdays, and both were the Tuesday after the second weekend of Extended Hours in their respective semester. Either blind chance was on our side those days, or Tufts is big on keeping the same exam style no matter what. Go figure.
Incidentally, this year I became curious about how busy the floors were when compared with each other. The answer is this rather silly looking chart.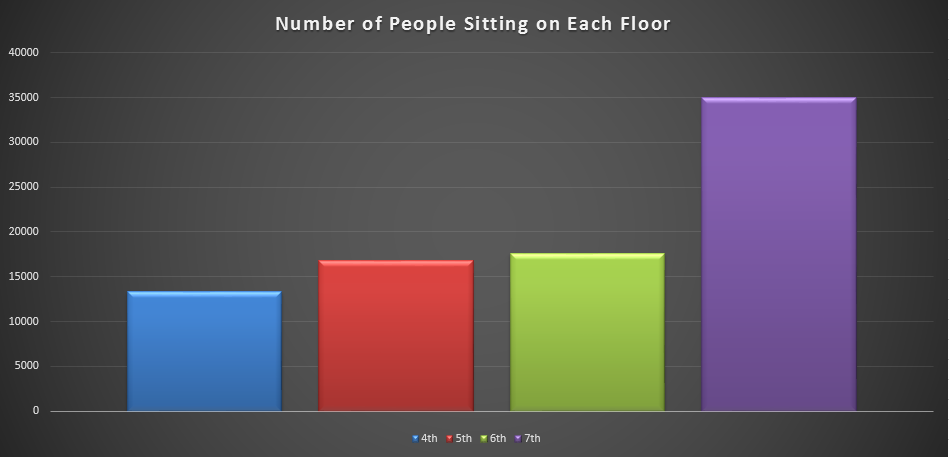
See that purple there? That’s the 7th floor. It was twice as busy as the 6th floor. Twice! We counted people 35,000 times on the 7th floor this last year! The others don’t even come close. Obviously, part of this can be explained by the fact that we added so much new furniture last year, but that’s not the entire story. I think it’s safe to say that students around here just really like their quiet space to study.
“But Tom,” you ask, “how do these kinds of numbers compare with past years?” Well I’m glad you asked that, HHSL Blog Reading Person, because I have an answer for you! The chart below is the total number of people we’ve counted in the library, by month, over the last 4 years.
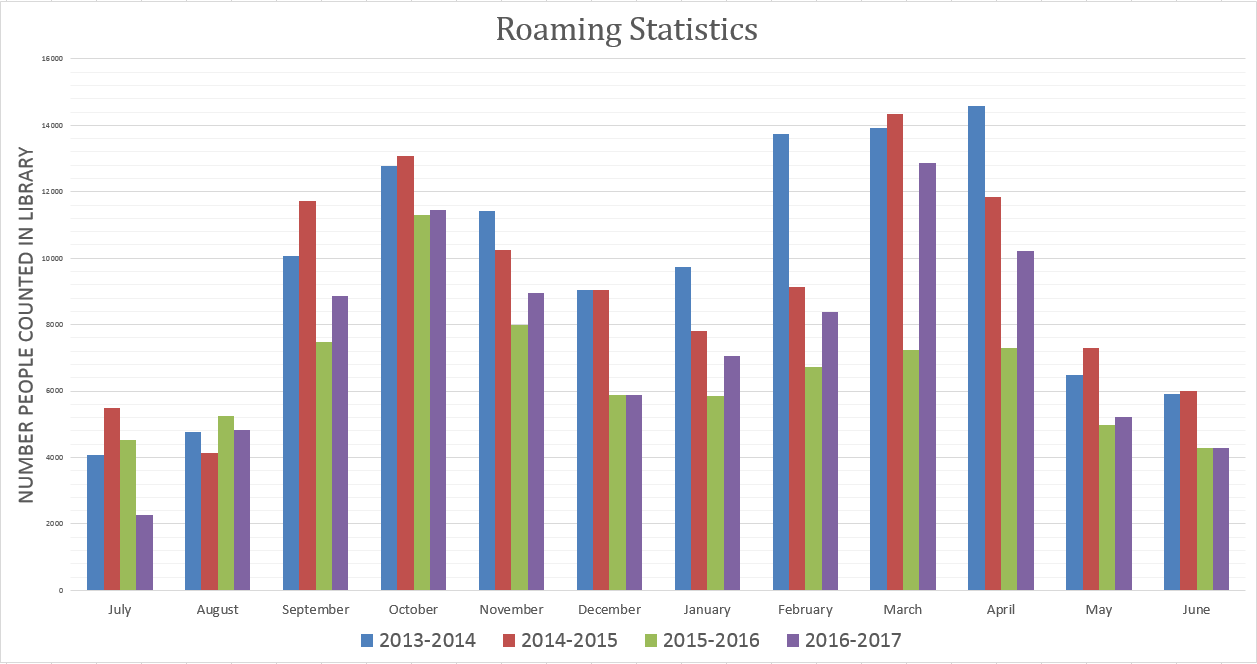 The purple would be this year. It looks like a lot, but you can see the same sort of wave formation every single year – we start off slow in the summer, get busy in the fall, slow down in the winter (we only get about half of December’s days counted due to the break, and January starts off slowly anyway), and then the whole thing picks back up in time for all the exams, only to slow back down in June.
What does this tell us, then? Well, we’ve been busy. We’ve been very busy. As you can see, everything sort of spiked back in 2014-2015, but this year was consistently busier than the year before it. July and August were the exceptions, but I’m certain that March and April more than make up for those.
Seeing these numbers go up and down over the years presents an interesting thought challenge: why do they fluctuate so much? Well, a little of it is human error, a little bit is due to changes in how we collect this data, a little of it is the way the programs on campus have been changing and adapting (which means the student body has been adapting), and part of it is sheer environmental factors. Snow days, for instance, or the way holidays fall – if we’re closed, we won’t be counting anybody!
“Okay Tom, I see. How about circulation? Surely human error is minimized when you have a program doing all your counting for you.”
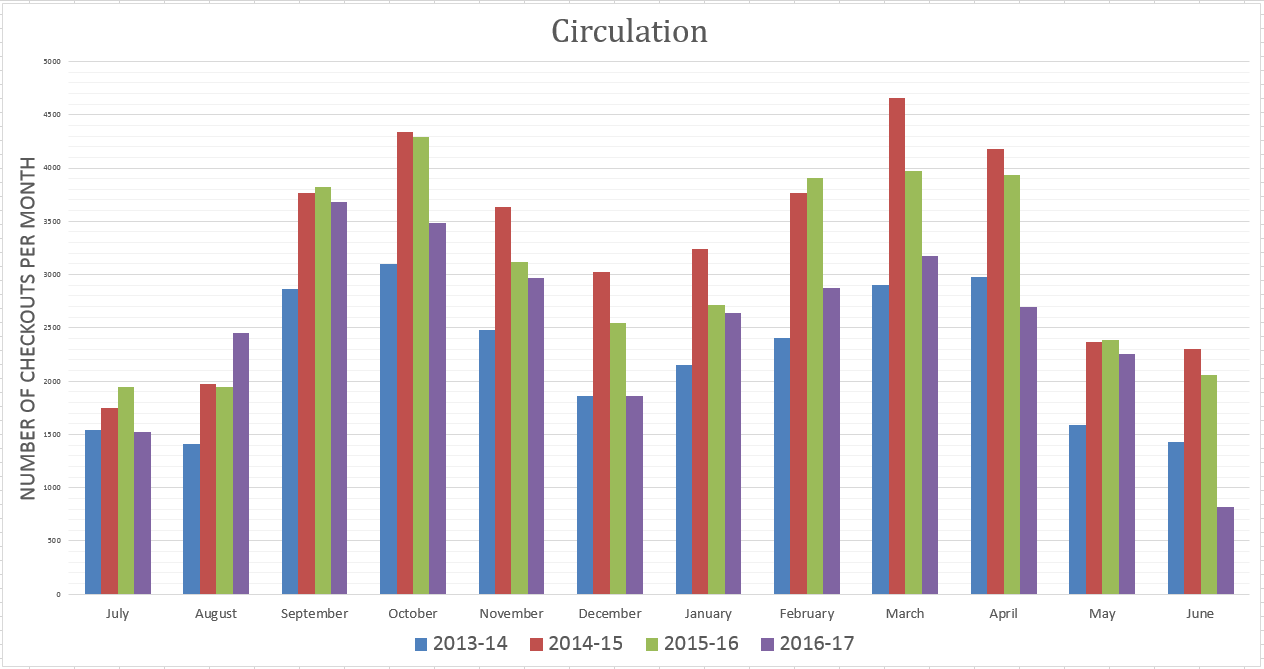
Note: We got a new circulation system in June 2017, so the numbers got interrupted.
You would be right. And you’re about to really enter the head-scratcher.
Somehow we were insanely full this year, while also having our second slowest year of checkouts since we started collecting these numbers this way. We have a ton of new resources for you, but circulation is down? Let me share the secret answer: the Internet. HHSL is constantly searching out new digital books, journals, and databases for everyone on campus, which means our physical books are not in as high demand as they used to be. So while the overall circulation is down, what is circulating is getting checked out like mad – for instance, our phone chargers alone registered 8,000 checkouts this year. The busiest year yet for them!
In case you were curious (I know you were) the most checkouts we had in a single day was 210 checkouts, which belongs to Wednesday, October 5th. 9 out of the 10 busiest circulation days were in the fall (with February 27th clocking in at #7). That particular information doesn’t really tell us much, but it’s fun to know all the same.
For the record, “busiest circulation day” is only in reference to amounts of checkouts (and subsequent check-ins) in a given day. It doesn’t count all of the times that librarians have a consultation with someone to help with research, or the times that the library staff at the Service Desk troubleshoot or help you find articles, or all the direction given, or printing problems fixed, or on-the-fly assistance with programs like EndNote…it’s a helpful metric, but it’s not the full story. Heck, it’s missing the craft events! You can’t have a complete picture without those.
All of these numbers are pieces to a puzzle, and it’s one we’re always working on here. You’re looking at a few pieces of it, but there are always more to add. And we’re always looking for more of those pieces, be it anything mentioned above or be it School Affiliation data. So as we enter the 2017-2018 year, keep your eye open for people walking around with clipboards and say hi! And who knows, maybe you’ll be part of one of these charts in the future.
-Tom-
Share this post!


Follow Us!


