Hi everyone,
Time for another installment of my statistics posts! Since the big annual post last June, we’ve changed a little about what we collect, so sadly I don’t have handy available data for which one of our circulation days was the busiest this past year (although I will still be telling you the month). But I can tell you right off the bat that the day we counted the most people studying was November 28th, 2018, when we counted 911 people sitting in our library over the course of the day. 911! That is so many people! Part of it, of course, is all the new seating we keep getting, because we here at Hirsh Library care about where you’re going to sit for your (frankly incredibly long) study sessions. Part of it is probably that we’re just so darn nice.
Leo the Skeleton, winner of my personal secret Nicest Colleague Award, six years running.
Anyway, you are here for some quick bar graphs and neat facts, and far be it from me to keep you from them! First off, here’s a bar graph of the last year’s worth of circulation stats (in blue) and head/seating counts (in red). These can be difficult to compare, since the numbers vary so far from one another (you may notice, for instance, that the circulation stats for a month never go above 3,000, but the seating counts never drop below that number). That is due simply to the digital nature of the schools here nowadays. Many of the students on this campus can stick with their computers, notes, and any textbooks they happen to own, and never really need to come to the desk. Which is a little too bad, given that we have so much stuff for you, but that’s life. What matters here is that heavens to Betsy we had 3,023 checkouts in October! That averages 100 a day, but I can tell you from experience (and I have numbers in past years to back this up) that not all days are created equal. Weekends and holidays are slower, so to make up for those, we would have had single days getting up around the 200 checkout mark. My guess is a Tuesday or Wednesday right before a major anatomy exam.

Click to enlarge.
Now, just because nothing is fun if it lines up properly, October was the busiest month with checkouts (I won’t get into things like questions, consultations, or the sheer volume of EndNote assistance and troubleshooting I have personally offered), but November was actually the busiest month for students in seats, to the tune of 9,274 people counted. Egad! We only have four floors in this building, and the bulk of people (nearly half!) are on the 7th floor.
Incidentally, this seems like a good moment to mention we have foam ear plugs down at the Library Service Desk. They’re free, and you can keep them. We also have headphones you can check out, which cover your ear entirely. Great for blocking noise out!
These graphs always follow the same kinds of patterns, although I was honestly surprised that November took home the gold here. With the Thanksgiving break, it has never been out front like that. But from what I’ve been hearing on the grapevine (….hydrated humerus?), the schools have been shifting their academic schedules around, so I for one will be very interested to see how that effects our numbers.
Speaking of the floors: BAM! Have a chart about the floors. Remember I mentioned how busy the 7th floor is around here? Well I do not make those claims without the numbers to back me up, and hot dang the 7th floor got crazy busy. Particularly -interestingly enough – in January. Why was January the busiest month for the 7th floor? I can answer that the same way I can answer the question “Why do we pay more for the MBTA now but the service has somehow gotten worse?” And that answer is: I don’t know. Magic? Probably magic.
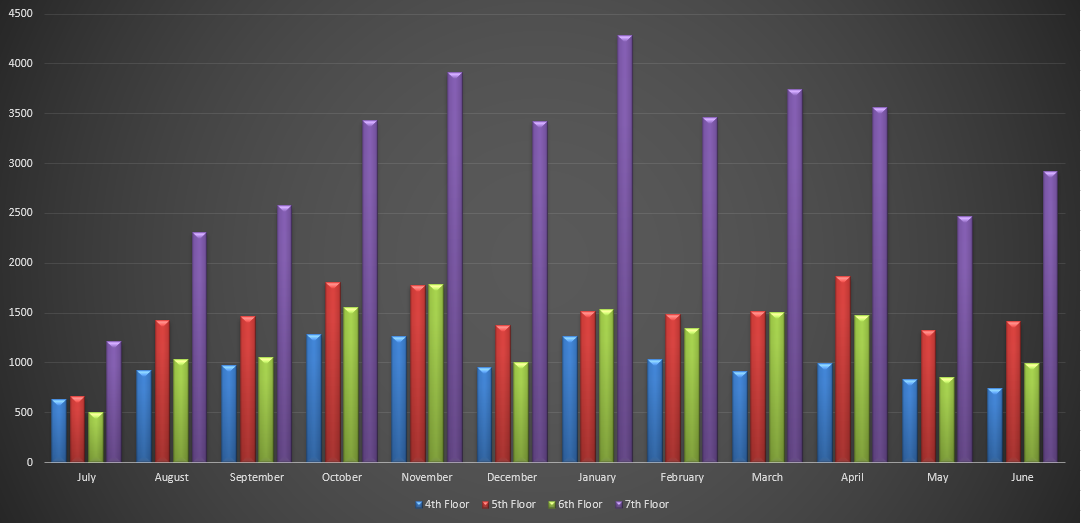
Click to enlarge.
But I do find it cool (hah!) that it happened. I love little mysteries like the January 2019 one. 4,285 people counted on the 7th floor that month, the highest number of people counted on any floor in any month. And I wasn’t kidding about nearly half: that month, the 7th floor accounted for 49.8% of the 8,600 people counted in the library.
I joke around a lot on this blog, but in complete seriousness, I can speak for everyone here at Hirsh when I say: we’re glad you like it here so much, and are willing to spend so much time here. We try very hard to make sure you’re comfortable and have seating and food options for your long study sessions, so these kinds of numbers are good to see. It’s why I collect them in the first place.
Finally, did you know that back in April I wrote a post about the Affiliation Statistics we do here? If you want the full detail I recommend checking that post out, I just want to highlight the day-of-the-week breakdown I did from that post.

Click to enlarge.
You may notice that Monday is the busiest day of October, but Wednesday is the busiest day of March. That kind of thing happens a lot here, and things that seem to effect it are: weather patterns, exam schedules, food specials at the cafe, classes, and whether it’s a holiday week (Indigenous Peoples’ Day in October sometimes has a large effect, and sometimes not). I suspect that there’s also a bit of “I’ve been studying too much lately” and “Oh no Boards are upon me!” also happen, but while we collect all this data, we try very hard to not interrupt your studying.
So, where does this leave us? Well every year is a little different than years prior, and although this gives us a good blueprint for the upcoming year, the desk already feels significantly busier this week than it has in previous Orientation weeks, so there will be some improvisation as well. There always is. But if you’re like me, that’s exciting! Just means more of a challenge.
I hope you all have a great rest of your summers! Welcome back if you’re here, and if you’re not quite yet then make sure you get some beach trips in while you can. Class is around the corner.
And if you’re in the library, make sure to come say hi to me at the Library Service Desk on the 4th floor! I’m here all night.
Statistically yours,
Tom
Share this post!


Follow Us!


