Hello everyone, and welcome back to Hirsh Library! It’s been good seeing those of you who have been around, and I hope the rest of you can make it sometime soon. Because fun fact: we’re open our full hours! You may have heard. I know some of you have heard, because just this past October we went around asking where you were from, and now we’ve got the data to prove it!
All the graphs you see below are from the library staff walking around for one week in October, asking the question “What program/school are you with?” You can click on them to make them larger if need be. If you’re interested in comparing this set of numbers to the way things looked pre-pandemic, then I would recommend checking out the post I wrote about the October 2019 Affiliation survey (please note: we did things a little bit different this time around, so it’s not a perfect 1 to 1 comparison, but it’s solid data all the same).
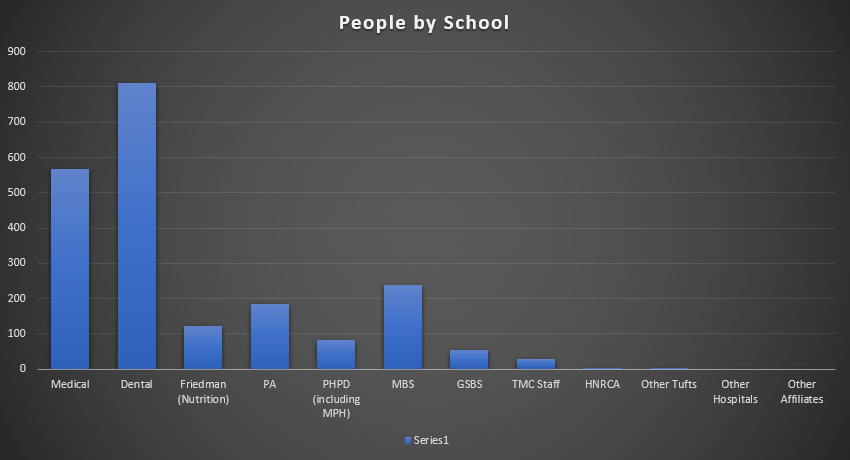
I’ll start with the information everyone always asks about first: how did the programs compare, numerically? Well, over the week 810 people told us they were with the Dental school, and 568 told us they were with Med. For those who weren’t here before the pandemic landed, you’ll be interested to know two facts: 1) that the numbers are lower than they were in 2019, but that the percentages here hold steady, and 2) I was honestly surprised at how many people turned up on this survey. It’s so great to see so many people are coming into the library, even when their classes are hybrid or even primarily online. And look at the rest of this spread! Friedman, PA, PHPD, and GSBS are all turning up in good numbers, and MBS has a strong showing at 238.
Hilariously, if you compare this data to its equivalent from 2019, you’ll realize that Dental, Medical, and PA all have lower numbers than two years ago, but somehow the other programs all went up. MBS being at 238 actually places it in third place for total counted for both 2019 and 2021.
Just goes to show: we’ve got some good furniture and space here.
But how does the furniture and space effect the counts? Glad you asked!

Everyone loves the 7th floor. This has never been in question, but seeing it laid out like this really drives it home. Normally, when I see numbers like this, the 7th floor is about double the next closest floor, which fluctuates between the 5th and 6th floors. This time, the 5th floor had 426 people, and the 7th had 1021. Amazing. And heartening to see!
The remaining ways of looking at these numbers are to break it down by weekday, and by time of the day. Here are those two charts:

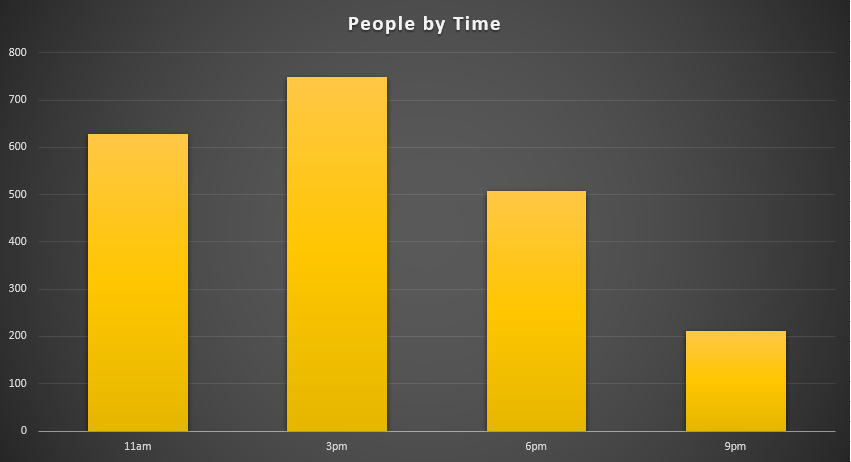
After the other two charts, these don’t provide anything too shocking. Thursday being the busiest day and 11am being the busiest time actually track with the way things were when we were closer to full capacity – the most popular weekday tended to fluctuate month-to-month between Tuesday, Wednesday, and Thursday, but the closer you are to lunch the busier the library gets.
Which is fair. Who doesn’t study with their stomach, after all?
I will leave you today with this thought: we have a staff full of people here to help, and we have a Reserves collection absolutely chock full of books, anatomy models, phone and laptop chargers, laptops, and about a dozen other things to help keep you supplied and comfortable while you’re studying and working on your papers, so that you can excel here at Tufts. In fact, we are stocked for numbers of visitors significantly higher than what you see in this post.
So why not stop on by to the Library Service Desk on the 4th floor of Med Ed, and see what we have to offer? We may surprise you.
In the meantime, have a great rest of your semester!
~Tom~
Share this post!


Follow Us!


