Category Archives: Techniques

The Next Frontier for Diagnostic Imaging

The advent of Magnetic Resonance Imaging (MRI) revolutionized the way medical practitioners diagnose and track diseases throughout the body. MRI utilizes magnetic properties of ions in the body along with computer-generated radio waves to create detailed images of the body’s organs and tissues4. This allows for the detection of cancers, traumatic brain injury, strokes, aneurysms,  spinal cord disorders, and other  ailments, without exposing patients to radiation or necessitating the use of intravenous dyes as required in other forms of diagnostic imaging. While many advances in MRI technology have been made to implement artificial intelligence for image reconstruction, increasing magnetic field strengths, optimizing receiver coil arrays, and enhancing imaging gradients, there remains an ongoing need to prioritize expanding access of these technologies on a global scale.

One area of advancement in MRI research that has received recent attention is the use of lower field-strength (0.2 Tesla) MRI systems2,3. These systems were once thought to provide suboptimal imaging quality as they utilize a substantially lower magnetic field strength compared to modern MRI systems. Integration of artificial intelligence for low-field MRI systems provides the capability for its images to compete with the resolution of that of a high-field MRI2. There are several advantages to low-field MRI that directly impact healthcare facilities and the patients they serve. Importantly, low-field MRI does not require a cooling system nor a large energy source in order to function properly1,2,3,5. This allows for a reduction in the ongoing costs associated with MRI systems in addition to a reduction in the high maintenance fees (~$10 thousand per month) and acquisition costs (~$1million/T) that are required of high-field MRI systems1,3,5. For under-resourced healthcare centers, these fees can be the determining factor for whether or not a patient receives a lifesaving diagnostic scan.

The utility of low-field MRI systems extends beyond cost savings, however. Due to the smaller magnetic field, noise produced by these systems is reduced which favors its use among pediatric populations1,3,5. In 2020, the FDA approved the use of the first portable point-of care low-field MRI (Below is a video of Dr.Kevin Sheth, a critical care neurologist at Yale School of Medicine discussing the advent of a the world’s first portable low-field MRI). Its small footprint and open design allows for family members to remain at the bedside with patients as they receive their scan1,2,3,5. The small footprint of these systems also makes its use in preclinical research settings more accessible. The open design of these systems is an additional benefit for patients with claustrophobia as well as obese patients that have difficulty in high-field MRI systems. Widescale clinical use of low-field MRI would expand access for patients that have metal implants such as pacemakers or shunts, who otherwise would not receive such diagnostic imaging2. Given the ability of a portable low-field MRI system to provide cost savings to healthcare facilities, expand access to patients in need, and further diagnostic capabilities for practitioners, low-field MRI systems are posed to pioneer a new era of medical diagnostic imaging.

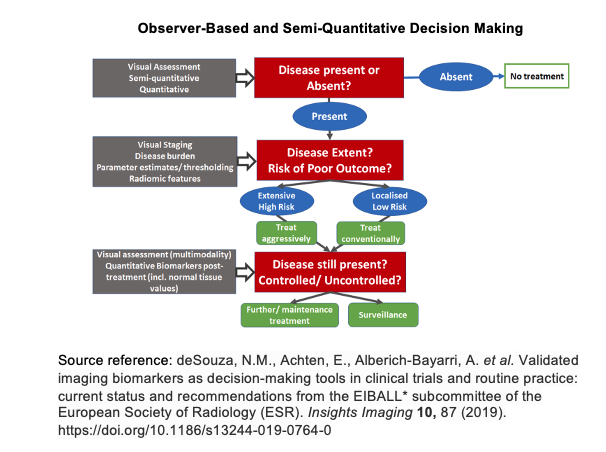
Incorporating artificial intelligence into low-field MRI diagnostic imaging stratifies the detection of disease by combining the observer-based image interpretation currently in practice with an artificial intelligence generated semi-quantitative approach (please see observer-based and semi-quantitiative decision making diagram below). In doing so, as larger datasets of diagnostic images are collected, artificial intelligence algorithms become more reliable in detecting disease pathology. Such measures may be used to not only detect disease but to better inform clinicians of potential treatment responses and health outcomes of their patients.

  1. Cooley CZ, McDaniel PC, Stockmann JP, Srinivas SA, Cauley SF, Śliwiak M, Sappo CR, Vaughn CF, Guerin B, Rosen MS, Lev MH, Wald LL. A portable scanner for magnetic resonance imaging of the brain. Nat Biomed Eng. 2020 Nov 23. doi: 10.1038/s41551-020-00641-5. Epub ahead of print. PMID: 33230306.
  2. Ghadimi M, Sapra A. Magnetic Resonance Imaging Contraindications. [Updated 2020 May 24]. In: StatPearls [Internet]. Treasure Island (FL): StatPearls Publishing; 2020 Jan-. Available from: https://www.ncbi.nlm.nih.gov/books/NBK551669/
  3. Grist, T. M. (2019). The Next Chapter in MRI: Back to the Future? Radiology, 293(2), 394-395. doi:10.1148/radiol.2019192011
  4. J.P. Hornak, The Basics of MRI, Interactive Learning Software, Henrietta, NY, 2020, http://www.cis.rit.edu/htbooks/mri/.
  5. Sarracanie, M., & Salameh, N. (2020). Low-Field MRI: How Low Can We Go? A Fresh View on an Old Debate. Frontiers in Physics, 8. doi:10.3389/fphy.2020.00172
  6. Sheth KN, Mazurek MH, Yuen MM, et al. Assessment of Brain Injury Using Portable, Low-Field Magnetic Resonance Imaging at the Bedside of Critically Ill Patients. JAMA Neurol. Published online September 08, 2020. doi:10.1001/jamaneurol.2020.3263

How Do You Figure?: Graphic Design Software For Scientists

As I sit at home writing what will (hopefully) be my very first first-author manuscript, I began to wonder how scientists go about making their figures for a paper. Like many things in academia, it was probably going to be lab-specific: someone would have started using a particular software, taught the next graduate student how to use it before they left, and that student would teach the next. And so on, and so forth.

With this in mind, I took to Twitter to ask students (and @AcademicChatter), how, exactly, were they figuring?

BioRender (@vanesque89, @Nicole_Paulk)

Price: Free for personal/educational (limited) use, various paid plans
Platform: Web-based

Think of BioRender as your scientific clip-art library. BioRender has a collection of over 20,000 different icons covering more than 30 fields of the life sciences. The colors of each icon can be customized, and the drag-and-drop functionality makes figure creation very quick. Even better, there’s nothing to download! It’s right there in your browser, ready whenever and wherever you are working.

CorelDraw (@AdemaRibic)

Price: $249/year or $499 (one-time purchase)*
Platform: Windows, Mac

Originating in Ottawa, Canada, CorelDRAW touts vector illustration, layout, photo editing, and typography tools. It works on both Windows and MacOS.

*Editor’s note: Corel Education Edition is a one-time payment of $109 (thanks to Adema Ribić for this correction!)

Adobe Photoshop and Illustrator (@Nicole_Paulk)

Price: $20/month for the first year, $30/month after that (student pricing, includes all Adobe apps)
Platform: Windows, Mac, some apps available for iOS and Android

Almost everyone is familiar, at this point, with Adobe Creative Cloud, Adobe’s suite of software for designing things (literally, any and all of the things). Photoshop is useful for raw images (such as overlaying fluorescent images and stitching together microscope images). Illustrator, in contrast, is for creating vector art and illustrations, but it’s also useful for aligning the different panels for a cohesive figure. The most updated version of Illustrator seems to have kept this in mind: the Adobe website specifically mentions its use in making infographics, including the ability to edit data through a charts function.

GraphPad Prism
Price: $108/year (student pricing)
Platform: Windows, Mac

Prism is less for making figures and more for making graphs, but it’s worth mentioning here since many of us include graphs in our figures. In Prism 8, you can draw lines or brackets on graphs to indicate significance. A centered text box is automatically included for your asterisks! These graphs can be exported as images and then arranged easily in another application as panels of a figure.

Affinity Photo and Designer (@SimonWad)
Price: $50 per app, one-time purchase
Platform: Windows, Mac, iPad

These are popular alternatives to Adobe Photoshop and Illustrator. One of the major complaints about Adobe was its movement to a cloud-based subscription model. Affinity uses a one-time purchase model, and is also considerably more affordable. The company also has an alternative to Adobe InDesign (called Publisher).

This is by no means an exhaustive list of all the possible software you could use to make a figure. Many people swear by PowerPoint as their favorite way of assembling figures. Here are a few other pieces of software to check out that are free to all:

Gimp
Price: Free!
Platform: Windows, Mac, Linux

Gimp is a high-quality raster image editor. Think of this as the free version of Photoshop. It can do a lot of the same things, but it’s missing some of the advanced tools, such as using adjustment layers to non-destructively edit images.

Inkscape
Price: Free!
Platform: Windows, Mac, Linux

Inkscape is a vector graphics editor with shapes, layers, text on paths, and the ability to align and distribute objects. If you’re looking for something like Illustrator to handle vector graphics but don’t want to shell out the money, this is a great option!

Scribus
Price: Free!
Platform: Windows, Mac, Linux

Scribus is an open-source alternative to Adobe InDesign. It has many of the same features as InDesign, but unfortunately can’t open InDesign files.

Thank you to everyone who responded, and happy figuring!

Cover image by Mudassar Iqbal from Pixabay

Sources:
biorender.com
coreldraw.com
adobe.com/products/photoshop.html
adobe.com/products/illustrator.html
graphpad.com
affinity.serif.com
products.office.com
gimp.org
digitaltrends.com/photography/gimp-vs-photoshop/
inkscape.org
scribus.net

Top Techniques: Single-Cell RNA Sequencing

Image from Papalexi E & Satija R, Single-cell RNA sequencing to explore immune cell heterogeneity. Nat Rev Immun (2017).

As scientists ask increasingly focused and nuanced questions regarding cellular biology, the technology required to answer such questions must also become more focused and nuanced. In the last decade, we have already seen several significant paradigm shifts in how to process data in a high-throughput manner, especially for genomic and transcriptomic analyses. Microarrays gave way to next-generation sequencing, and now next-generation sequencing has moved past bulk sample analysis and onto a new frontier: single cell RNA sequencing (scRNA-Seq). First published in 2009, this technique has gained increasing traction in the last three years due to increased accessibility and decreased cost.

So, what is scRNA-Seq?

As the name suggests, this technique obtains gene expression profiles of individual cells for analysis, as opposed to comparing averaged gene expression signals between bulk samples of cells.  

When and/or why should I use scRNA-Seq compared to bulk RNA-Seq? What are its advantages and disadvantages?

The ability to examine transcriptional changes between individual cells uniquely allows researchers to define rare cell populations, to identify heterogeneity within cell populations, to investigate cell population dynamics in depth over time, or to interrogate nuances of cell signaling pathways—all at high resolution. The increased specificity and subtlety given by single-cell sequencing data benefits, for example, developmental biologists who seek to elucidate cell lineage dynamics of organ formation and function, or cancer biologists who may be searching for rare stem cell populations within tumor samples.

Practically, scRNA-Seq often requires far less input material than traditional bulk RNA-Seq (~103-104 cells per biological sample, on average). The trade-off for this downsizing advantage, however, is because of the lower input, there is often more noise in the output data that requires additional filtering. Also, as with any rising star high-throughput technique, standardized pipelines for bioinformatics processing of the raw output data are still being finalized and formalized. As the same type of growing pains occurred when bulk RNA-Seq rose to prominence, no doubt a more final consensus will also eventually be reached for scRNA-Seq.

What platforms are used for scRNA-Seq?  

The three most current and common workflows to isolate single cells for sequencing are by microplates, microfluidics, or droplets.

Microplate-based single cell isolation is carried out by laser capture of cells, for example by FACS, into wells of microplates. This approach is useful if there are known surface markers that can be used to separate cell populations of interest. It also provides the opportunity to image the plate and ensure that enough cells were isolated and that it was truly a single cell isolation. Reagents for lysing, reverse transcribing, and preparing libraries are then added to individual wells to prepare samples for sequencing.   

Microfluidics-based single cell isolation consists of a chip with a maze of miniature lanes that contain traps, which each catch a single cell as the bulk cell mixture is flowed through. Once cells are caught within the traps, reagents for each step of the sample preparation process (lysis, reverse transcription, library preparation) are flowed through the chip lanes, pushing the cell contents and subsequent intermediate materials into various chambers for preparation, followed by harvesting the final material for sequencing.

Droplet-based single cell isolation also uses microfluidics but instead of traps it involves encapsulating, within a single droplet of lysis buffer, (1) a single cell and (2) a bead linked to microparticles, which are the reagents necessary for sample preparation. The advantage of this approach is that a barcode can be assigned to the microparticles on each bead, and thus all transcripts from a single cell will be marked with the same barcode. This aspect allows pooling of prepared samples for sequencing (decreasing cost) as the cell-specific barcodes then can be used to map transcripts back to their cell of origin.

The other significant consideration for designing scRNA-Seq experiments is what sequencing method to use. Full-length sequencing provides read coverage of entire transcripts, whereas tag-based sequencing involves capture of only one end of transcripts. While the former approach allows for improved mapping ability and isoform expression analyses, the latter allows for addition of short barcodes (Unique Molecular Identifiers, UMIs) onto transcripts that assist in reducing noise and bias during data processing.    

So, which platform should­ I use?

As with most advanced techniques, determining which platform to use depends on the biological question being asked. A microplate-based platform does not accommodate high throughput analyses but does allow for specificity in what types of cells are being analyzed. So, for example, it would be a good choice for investigating gene expression changes within a rare population of cells. It also does not require particularly specialized equipment (beyond a FACS machine) and thus is a relevant choice for researchers without access to more sophisticated options. Microfluidics-based platforms are capable of more throughput than microplate-based while retaining sensitivity, but they are more expensive. Finally, droplet-based platforms provide the greatest amount of throughput but are not as sensitive. Thus, they are most appropriate for elucidating cell population composition and/or dynamics within complex tissues.

How can my scRNA-Seq data be processed, and is it different than bulk mRNA-Seq data processing?

Performing computational analysis on scRNA-Seq data follows a similar pipeline as bulk RNA-Seq, though there are specific considerations required for scRNA-Seq data processing, especially during later stages of the pipeline. One of the major considerations is significant cell-to-cell discrepancies in expression values for individual genes. This effect occurs because each cell represents a unique sequencing library, which introduces additional technical error that could confound results when comparing cell-specific (and therefore library-specific) results. This effect can be mitigated during data processing by additional normalization and correction steps, which are included in most of the publicly available scRNA-Seq processing pipelines.

Finally, the types of interpretations drawn from scRNA-Seq experiments are also technique-specific and question-dependent. Common analyses of scRNA-Seq data include clustering, psuedotime, and differential expression. While clustering is done with bulk RNA-Seq data, clustering scRNA-Seq data allows for assessing relationships between cell populations at higher resolution. This aspect is advantageous for investigating complex tissues—such as the brain—as well as for identifying rare cell populations. Given the large sizes of scRNA-Seq data sets, performing clustering of scRNA-Seq often requires dimensionality reduction (i.e. PCA or t-SNE) to make the data less noisy as well as easier to visualize. By coupling clustering results along with differential expression data, identifying gene markers for novel or rare populations is made easier. Psuedotime analysis is particularly useful for scRNA-Seq experiments investigating stages of differentiation within a tissue. Using statistical modeling paired with data reflecting a time course (for example, various developmental stages of a tissue), this analytical method tracks the transcriptional evolution of each cell and computationally orders them into a timeline of sorts, thus providing information relevant for determining lineages and differentiation states of cells in greater detail.  

Where can I do scRNA-Seq in Boston?  

Tufts Genomics Core here at Sackler has a Fluidigm C1 machine (microfluidics). Harvard Medical School (HMS) has several options for single-cell sequencing platforms. HMS Biopolymers Core also has a Fluidigm C1 system that is available for use on a for-fee, self-serve basis after training, with reagents purchased and samples prepared by the individual, as well as a 10X machine (droplet). HMS Single-Cell Core has a inDrop machine (droplet) that includes for-fee full service with faculty consultation.

What is the future for scRNA-Seq?

Bettering the way in which samples are processed and data is analyzed is a priority for scRNA-Seq experts. Specifically, ongoing work seeks to improve library preparation and sequencing efficiency. The programs used to process scRNA-Seq data are also still in flux so as to provide better normalization and correction tools for increasingly accurate data. On a larger scale, developing technology to analyze other biological aspects (genomics, epigenomics, transcriptomics) at the single cell level is of high interest, especially when considering how powerful combining these other forms of single-cell analysis with transcriptomics could be for understanding both normal and disease biology.

Resources:

  1. scRNA-Seq software packages: https://github.com/seandavi/awesome-single-cell
  2. Review of bioinformatics and computational aspects of scRNA_Seq: https://www.frontiersin.org/articles/10.3389/fgene.2016.00163/full
  3. Practical technique review: https://genomemedicine.biomedcentral.com/articles/10.1186/s13073-017-0467-4
  4. Start-to-finish detailed instructions on scRNA-Seq: https://hemberg-lab.github.io/scRNA.seq.course/biological-analysis.html

Top Techniques: So you want to study metabolism…

Written by Daniel Fritz and Judi Hollander


When studying the phenotype of a particular cell line or observing changes after cell treatment it is often desirable to establish the relative contributions of various metabolic pathways.  Agilent’s (formerly Seahorse Bioscience’s) Seahorse XF Analyzer fulfills the role of a capable, easy-to-use platform to gather important bioenergetic data, all in real time.  While this instrument has been around for roughly ten years, it had been relegated to niche fields and saw relatively little exposure.  In fact, many of you may not be aware that Tufts recently purchased one (a Seahorse XFe96, in case you were wondering)!  With more labs and fields now considering the details of cell metabolism within the framework of their research, the Seahorse XF Analyzer (or “Seahorse”, for short) has become something of a gold standard when discussing cellular metabolism profiles and nutrient preference.  With the addition of a Seahorse analyzer to Sackler, now is as good a time as any to consider adding this instrument to your toolbox.

At this point you may be thinking, “Dan, Judi, this all sounds great, but what exactly does it do?” Good question!  Let’s discuss what exactly the Seahorse XF Analyzer measures and how it does so.  Principally, the Seahorse investigates the balance of mitochondrial oxidative phosphorylation and glycolysis within a population of cells.  The instrument is loaded with a stacked double plate.  The lower plate is a relatively simple multi-well plate that the researcher seeds with the cells of study.  The cells form a monolayer along the bottom with a small volume of media on top.  The upper plate consists of probes for each well and four small-volume drug ports per well where the researcher can preload the compounds of interest in order to test the cells’ metabolic response.  The instrument is programmed to inject specific drug ports at precise times and the well-specific probes are lowered into the media to form a microchamber where pH and oxygen level within the media can be measured.  Changes in pH and oxygen level are a consequence of the cells undergoing metabolic processes in response to the drug treatment.  The analyzer can then calculate the rate of change in these parameters, resulting in Extracellular Acidification Rate (ECAR) and Oxygen Consumption Rate (OCR), respectively. These parameters are indicative of how fast glycolysis and mitochondrial oxidative phosphorylation metabolic pathways are working.

With Seahorse, the most important part of your assay will be determining what question you want to ask.  Because of its sensitivity and capabilities, it is very easy to get lost in the amount of data you are collecting.  To aid you in your research, Agilent has a variety of kits available that can answer common questions, and their representatives are more than happy to work with you to develop a custom assay to fit your needs.  Each kit supplies a pre-measured amount of certain drugs, which are injected into wells during the assay.

Questions Assay
  • Are my cells undergoing a metabolic switch?
  • How much proton efflux is due to glycolysis?
Glycolytic Rate Assay
  • How are key mitochondrial parameters changing in my cells?
Cell Mito Stress Test
  • What is the baseline metabolic phenotype of my cells?
  • What is the metabolic potential of my cells?
Cell Energy Phenotype Test
  • What type of fuel (glucose, glutamine, fatty acids) is preferred by my cells?
  • How flexible are my cells toward using other fuels when the preferred fuel is unavailable?
Mito Fuel Flex Test
  • How capable are my cells of using glycolysis when oxidative phosphorylation is blocked?
Glycolysis Stress Test

Additional information can be found at Agilent’s site: http://www.agilent.com/en-us/products/cell-analysis-(seahorse)/seahorse-analyzers?sh_0015

ICYMI: Public Relations and Communications Essentials for Scientists

When it comes to reporting our scientific findings, we are trained to compose manuscripts that are measured, precise and objective. The mainstream media, however, take a very different approach to broadcasting scientific news: headlines designed to grab readers tend to be more sensationalized and the articles draw more conclusive and overarching statements. These contrasting approaches to reporting are appropriate in their respective fields and it is important that we as scientists learn to take advantage of mainstream journalism for the publication of our discoveries, not only for the reputations of our university and ourselves, but also to share with the public, whose tax dollars fund most of our work, what we have accomplished. Enter the Tufts Public Relations Office—a fantastic resource that allows us the opportunity to share our research with the community outside of our scientific world. The purpose of the seminar du jour was to inform the Tufts community on how the office works and how to best use it to our advantage.

The purpose of the seminar was to provide some information on how to work with the PR office when you are ready to publish work that you would like to broadcast beyond scientific journals. Kevin, the assistant director of the office, stressed that the earlier you get in touch with the PR office, the better prepared they will be to help you. The best time to contact them about publicizing a manuscript is when you are submitting your final revisions to the scientific journal that will be publishing the paper. You will be asked to share your manuscript with the office so that Kevin and members of his team, who are well versed in reading scientific literature, can familiarize themselves with your work. Soon after, they will meet with you to discuss the details of your study, get a quote, and draft a news release that your PI can edit and approve. From there on out, the PR Office works to spread the word on your research via prominent blogs, science, local, and potentially national media, depending on your work’s level of impact. The PR Office is also equipped to help you interact with reporters effectively: they can prepare you to talk about your science in layman’s terms to be more relatable and better understood by the general public.

By sharing your work with more mainstream media, you build your reputation as well as credit your university, your funding agencies, and the tax-paying public. Reach out to the PR Office for more information on communicating your science with the rest of the world and take advantage of the great opportunities they offer that can make you a more visible and effective participant in the science world!

One last tip for those of you interested in improving your science communication skills–keep your eyes peeled for more details on our upcoming joint Dean’s Office / TBBC / GSC Event, Sackler Speaks in April!  This is a competition for students to pitch their 3-minute flash talks in front of a panel of judges.  Besides critical feedback on presentation skills, there will also be cash prizes for winning presentations!

Contacts at the Tufts PR Office, Boston Campus:

Siobhan Gallagher, Deputy Director (Siobhan.gallagher@tufts.edu)

Kevin Jiang, Assistant Director (Kevin.Jiang@tufts.edu)

Lisa Lapoint, Assistant Director (Lisa.Lapoint@tufts.edu)


Notes from Up North: What is an IDeA COBRE?

By Lucy Liaw, PhD Tufts/MMCRI

Here at Maine Medical Center Research Institute, we are very happy to be supporting Tufts trainees and working with many Tufts investigators here and in Boston to provide core facility services such as transgenic mouse generation.

Did you know that many of our core facilities were established at Maine Medical Center through a special NIH program, the Institutional Development Award (IDeA) Program? The IDeA program was established by Congressional mandate in 1993 to help develop research infrastructure to support biomedical research in 23 states that historically have had a low level of NIH funding. Maine is one of those states. In fact, there was a time when 50% of NIH funding went to researchers in 5 states (Massachusetts being one of those heavily funded states!), while the 23 IDeA eligible states together only received about 5% of all NIH funds. Over the last 23 years, NIH investment in biomedical research in Maine has contributed to a burgeoning biotech scene (http://www.mainebioscience.org/access_resources/bioscience-map-of-maine/) and a highly collaborative network of research institutes.

One of the components of the IDeA program is the Centers of Biomedical Research Excellence (COBRE). Maine Medical Center has been fortunate to have received two COBRE awards since 2000, one with the theme of Vascular Biology, and one in Stem and Progenitor Cell Biology. These awards have supported the recruitment of new junior investigators to Maine Medical Center (with appointments at Tufts University School of Medicine), and also the establishment and expansion of our core facilities.  Please visit our website at mmcri.org, and find “Core Facilities” under “Research Services & Resources” to see if we provide services that could be useful to your research!

Microinjection of mouse fertilized oocyte. Our Mouse Transgenic Facility performs genome modification using standard transgenesis, gene targeting in ES cells, or CRISPR/Cas. In 2017, we will start to offer services for CRISPR/Cas project design and sgRNA synthesis.


Imaging by microCT. We run a Scanco vivaCT40 for microCT imaging of bone, teeth, fat, and the vasculature. Image, above right, shows microfil perfusion of the vasculature of a tumor xenograft, used to quantify and measure tumor angiogenesis.


Proteomics and Lipidomics Core Facility. We run a mass spectrometry resource with state-of-the-art protein and lipid profiling capacity. Recent studies include experiments to study tissues including adipose tissues and the skeleton, and how their protein and lipid content changes during metabolic disease.


Histopathology Core Facility. We provide full services for tissue processing, embedding, sectioning, routine histology, and immunostaining. We work closely with our Maine Medical Center Biobank to generate tissue arrays for screening of human disease specimens from patients.

Top Techniques: NMR

What is NMR?
Nuclear magnetic resonance spectroscopy, or NMR spectroscopy, is a powerful technique that uses the magnetic properties of atomic nuclei to elucidate the chemical and physical properties of the atom or its molecule. The nuclei of certain atoms, such as 1H or 13C, align themselves with magnetic fields in nuclear energy levels known as ‘spin states.’ When molecules are placed in an external magnetic field and irradiated with radiofrequency (RF) waves, certain atomic nuclei present in the sample absorb energy. These RF waves flip nuclei from one spin state to another. If the RF is turned off, the nuclei relax, releasing energy in the form of RF waves, which are measured as the decay in signal intensity over the course of a few seconds. The time domain of these signals is converted to the frequency domain to produce a spectrum, what we normally think of as the output of an NMR experiment.

But what can you actually do with NMR? Traditionally, the technique has been used to identify molecules and determine their 3D structures. It can certainly do this; however, the actual range of applications for this technique is much wider. With metabolomics approaches, you can quantify biofluids and tumor and tissue extracts. Binding events, even very weak ones, between two proteins or between protein and DNA can be detected. You can also determine the stoichiometry of these binding events. Trying to compare a wild-type protein to its mutant variant? Characterizing the active site of your protein of interest? NMR can handle both of these tasks, and measure dynamics of the protein in its active conformation as well. To that end, NMR can also be used in live-animal imaging. If you’ve ever had an MRI, you may know that the technique is actually based on the science of NMR!

Figure 1. 1H-15N 2D spectrum of BPV-1 E2 DBD (310-410). Resonances of the DNA-bound protein (red) show chemical shift differences relative to the DNA-free sample (black) (taken from Veeraraghavan et al. Biochemistry (1999) 38: 16115-16124).

What facilities does Tufts have for NMR spectroscopy?
The Tufts NMR Center currently has 3 NMR spectrometers, all located in an environmentally controlled laboratory on the 6th floor of M&V.

The Bruker DRX-600 spectrometer used for structure determination of large protein domains and small proteins, as well as metabolomics experiments. It offers the highest resolution and sensitivity of the three instruments.

The Bruker AMX-500 spectrometer is good for examining peptides and small protein domains.

The Bruker DPX-300 spectrometer is useful if you need to check the identify or purity of products of organic synthesis. The system is set up to look at nonstandard nuclei, such as 11B.

The NMR Center is also in the process of upgrading the Bruker DRX-600 by replacing the console electronics. With this upgrade, features such as non-uniform sampling and cryogenic cooling, which can double the sensitivity of 2D and 3D experiments. Other upgrades to the hardware will increase the reliability, ease of use, and speed of data collection for this system. Users will be able to study the structure and dynamics of proteins and protein complexes with high molecular weights and limited solubility, which is limited by the current sensitivity of the instrument.

Information about the spectrometers available in the NMR Center can be found at the following website: http://medicine.tufts.edu/Faculty-and-Research/Core-Research-Facilities/Tufts-NMR-Center. With questions or for help planning an NMR experiment, please email Dr. Jim Baleja at Jim.Baleja@tufts.edu.

If you are interested in reading more about NMR spectroscopy, Bothwell and Griffin wrote a straightforward but in-depth article (Biological Reviews (2011) 86: 493-510).

Top Techniques: The Basics

Western Blot

PCR

IHC

Immunoprecipitation

Notes from the North – MMCRI mouse transgenic expertise from the comfort of your own bench!

Whether you’re hunting for an engaging and useful elective as a first/second year student or soaking up last minute knowledge before jumping into the job/post-doc market, I recommend considering Mouse Transgenic Models and Advanced Mouse Transgenic Models coordinated by Dr. Lucy Liaw of Maine Medical Center Research Center and Tufts Sackler. The aim of the modules is to deepen understanding of molecular biology’s most popular mammalian model organism and help participants design thoughtful and effective in vivo experiments.

The first module givinjectiones an overview of how to develop transgenic models of gene expression and gene targeting plus strategies for phenotypic characterization such models. When I took the course for transfer credit in spring 2015 we learned basic transgenic and gene targeting construct design, conditional and inducible systems, early embryonic mouse development in the context of pronuclear and blastocyst injection, and the effects of genetic background on models. We utilized what we were learning over the course of the module to develop a strategy for making a mouse model of our choice (construct design through phenotype characterization) with discussion of our design at the start of each class.

CRISPR

The second module focuses on cutting-edge techniques currently being used in academic and industry laboratories to generate transgenic animals. Last spring we reviewed genome editing via Zinc finger nucleases, TALENS, and CRISPR/Cas9. The assignment for this module was to revise our previous model employing the more recent techniques.

Both modules utilized lecture, discussion of primary literature, and project development/presentation to ground participants in mouse transgenic biology. The pace was rigorous; we met for 2 hours twice a week for 3.5 weeks per module, yet easy to integrate with benchwork.

These well established modules have been available through the UMaine graduate course catalog for four years and will be directly available to Sackler students starting spring 2017 (look up CMDB 0350 while browsing the Tufts SIS catalog). The UMaine Graduate School of Biomedical Science and Engineering students who have traditionally taken this course rely on a consortium of institutes across Maine for their training. Because of this, the Mouse Transgenics modules are designed to be highly compatible with teleconference style classrooms allowing excellent participant interaction and experience in telecommunication meetings (a skill not to be sneezed at in this era of global collaboration).teleconference

Resources for learning how to code

Last month, I put together a small script that made the calendar from the Sackler website accessible to calendar software such as Google Calendar, Apple Calendar, Outlook, and others, that a majority of people now use. This little simple bit of code solved a problem of the Sackler website that has existed for years and requires no further intervention on my part. I’ve put the source code online on GitHub for anyone who is interested in seeing how it works (https://github.com/danielsenhwong/sackler). For anyone who is interested in learning how to code or, like me, would like to develop their skills beyond the introductory undergraduate level, I’ve compiled a list of resources that may be useful.

Getting started

This is in many ways the most difficult part about learning how to code. Many resources exist, but it’s difficult to know which is the most approrpiate for your current skill level. You may already be somewhat familiar with some specific coding techniques or languagees, but significant gaps may still remain in your knowledgebase. Such gaps could include understanding how to set up a coding environment on your computer, which language is most suitable for your work, or how to interface with a database instead of just reading data from a file generated by your plate reader. As biomedical scientists, our familiarity with computers and code is limited compared to more computationally-intensive fields, but not compeltely absent, and our field is rapidly becoming more computational.

practicalcomputingFortunately, there is a book specifically intended for biologists who are interested in developing their computing skill set: Practical Computing for Biologists, by Steven Haddock and Casey Dunn. The book introduces basic concepts of coding while also providing a thorough walkthrough of how to set up a suitable environment on your computer before moving on to practical applications of coding and tools for data analysis, including working with databases and best practices for working with graphics and generating figures for publication. The companion website for the book makes much of the example code freely available, along with some other extras, including the reference tables, which are extremely useful while you’re still learning the commands: http://practicalcomputing.org/

lynda_logo1k-d_72x72Tufts Technology Services (Tufts IT) also has some resources available for free to the Tufts community, including access to Lynda.com, which hosts self-paced online tutorials for a number of different topics, including coding as well as software-specific training (Adobe Photoshop, Illustrator, InDesign, etc.). Additional details can be found on the Tufts IT website: https://it.tufts.edu/lynda

Integrating coding into your work

It can be difficult to learn how to code if it’s siloed away as a separate skill you’re trying to learn, so one effective technique is to integrate it into your normal workflow. One example would be to use R (r-project.org) in place of Excel or Prism to perform your statistical analysis. A good book for learning how to get started is Introductory Statistics with R, by Peter Dalgaard. A PDF version of this book is available for free through the Tufts library or heavily discounted for purchase: http://link.springer.com/book/10.1007%2F978-0-387-79054-1