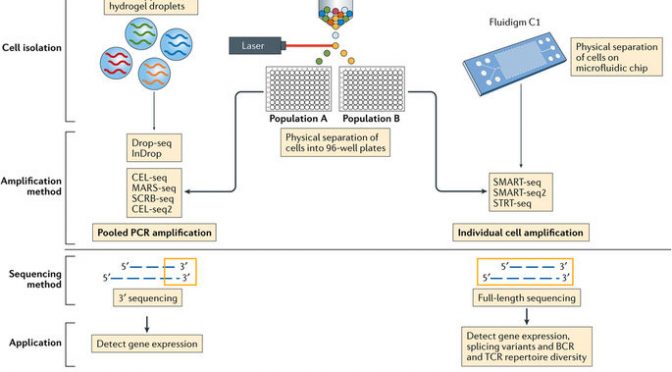
Image from Papalexi E & Satija R, Single-cell RNA sequencing to explore immune cell heterogeneity. Nat Rev Immun (2017).
As scientists ask increasingly focused and nuanced questions regarding cellular biology, the technology required to answer such questions must also become more focused and nuanced. In the last decade, we have already seen several significant paradigm shifts in how to process data in a high-throughput manner, especially for genomic and transcriptomic analyses. Microarrays gave way to next-generation sequencing, and now next-generation sequencing has moved past bulk sample analysis and onto a new frontier: single cell RNA sequencing (scRNA-Seq). First published in 2009, this technique has gained increasing traction in the last three years due to increased accessibility and decreased cost.
So, what is scRNA-Seq?
As the name suggests, this technique obtains gene expression profiles of individual cells for analysis, as opposed to comparing averaged gene expression signals between bulk samples of cells.
When and/or why should I use scRNA-Seq compared to bulk RNA-Seq? What are its advantages and disadvantages?
The ability to examine transcriptional changes between individual cells uniquely allows researchers to define rare cell populations, to identify heterogeneity within cell populations, to investigate cell population dynamics in depth over time, or to interrogate nuances of cell signaling pathways—all at high resolution. The increased specificity and subtlety given by single-cell sequencing data benefits, for example, developmental biologists who seek to elucidate cell lineage dynamics of organ formation and function, or cancer biologists who may be searching for rare stem cell populations within tumor samples.
Practically, scRNA-Seq often requires far less input material than traditional bulk RNA-Seq (~103-104 cells per biological sample, on average). The trade-off for this downsizing advantage, however, is because of the lower input, there is often more noise in the output data that requires additional filtering. Also, as with any rising star high-throughput technique, standardized pipelines for bioinformatics processing of the raw output data are still being finalized and formalized. As the same type of growing pains occurred when bulk RNA-Seq rose to prominence, no doubt a more final consensus will also eventually be reached for scRNA-Seq.
What platforms are used for scRNA-Seq?
The three most current and common workflows to isolate single cells for sequencing are by microplates, microfluidics, or droplets.
Microplate-based single cell isolation is carried out by laser capture of cells, for example by FACS, into wells of microplates. This approach is useful if there are known surface markers that can be used to separate cell populations of interest. It also provides the opportunity to image the plate and ensure that enough cells were isolated and that it was truly a single cell isolation. Reagents for lysing, reverse transcribing, and preparing libraries are then added to individual wells to prepare samples for sequencing.
Microfluidics-based single cell isolation consists of a chip with a maze of miniature lanes that contain traps, which each catch a single cell as the bulk cell mixture is flowed through. Once cells are caught within the traps, reagents for each step of the sample preparation process (lysis, reverse transcription, library preparation) are flowed through the chip lanes, pushing the cell contents and subsequent intermediate materials into various chambers for preparation, followed by harvesting the final material for sequencing.
Droplet-based single cell isolation also uses microfluidics but instead of traps it involves encapsulating, within a single droplet of lysis buffer, (1) a single cell and (2) a bead linked to microparticles, which are the reagents necessary for sample preparation. The advantage of this approach is that a barcode can be assigned to the microparticles on each bead, and thus all transcripts from a single cell will be marked with the same barcode. This aspect allows pooling of prepared samples for sequencing (decreasing cost) as the cell-specific barcodes then can be used to map transcripts back to their cell of origin.
The other significant consideration for designing scRNA-Seq experiments is what sequencing method to use. Full-length sequencing provides read coverage of entire transcripts, whereas tag-based sequencing involves capture of only one end of transcripts. While the former approach allows for improved mapping ability and isoform expression analyses, the latter allows for addition of short barcodes (Unique Molecular Identifiers, UMIs) onto transcripts that assist in reducing noise and bias during data processing.
So, which platform should I use?
As with most advanced techniques, determining which platform to use depends on the biological question being asked. A microplate-based platform does not accommodate high throughput analyses but does allow for specificity in what types of cells are being analyzed. So, for example, it would be a good choice for investigating gene expression changes within a rare population of cells. It also does not require particularly specialized equipment (beyond a FACS machine) and thus is a relevant choice for researchers without access to more sophisticated options. Microfluidics-based platforms are capable of more throughput than microplate-based while retaining sensitivity, but they are more expensive. Finally, droplet-based platforms provide the greatest amount of throughput but are not as sensitive. Thus, they are most appropriate for elucidating cell population composition and/or dynamics within complex tissues.
How can my scRNA-Seq data be processed, and is it different than bulk mRNA-Seq data processing?
Performing computational analysis on scRNA-Seq data follows a similar pipeline as bulk RNA-Seq, though there are specific considerations required for scRNA-Seq data processing, especially during later stages of the pipeline. One of the major considerations is significant cell-to-cell discrepancies in expression values for individual genes. This effect occurs because each cell represents a unique sequencing library, which introduces additional technical error that could confound results when comparing cell-specific (and therefore library-specific) results. This effect can be mitigated during data processing by additional normalization and correction steps, which are included in most of the publicly available scRNA-Seq processing pipelines.
Finally, the types of interpretations drawn from scRNA-Seq experiments are also technique-specific and question-dependent. Common analyses of scRNA-Seq data include clustering, psuedotime, and differential expression. While clustering is done with bulk RNA-Seq data, clustering scRNA-Seq data allows for assessing relationships between cell populations at higher resolution. This aspect is advantageous for investigating complex tissues—such as the brain—as well as for identifying rare cell populations. Given the large sizes of scRNA-Seq data sets, performing clustering of scRNA-Seq often requires dimensionality reduction (i.e. PCA or t-SNE) to make the data less noisy as well as easier to visualize. By coupling clustering results along with differential expression data, identifying gene markers for novel or rare populations is made easier. Psuedotime analysis is particularly useful for scRNA-Seq experiments investigating stages of differentiation within a tissue. Using statistical modeling paired with data reflecting a time course (for example, various developmental stages of a tissue), this analytical method tracks the transcriptional evolution of each cell and computationally orders them into a timeline of sorts, thus providing information relevant for determining lineages and differentiation states of cells in greater detail.
Where can I do scRNA-Seq in Boston?
Tufts Genomics Core here at Sackler has a Fluidigm C1 machine (microfluidics). Harvard Medical School (HMS) has several options for single-cell sequencing platforms. HMS Biopolymers Core also has a Fluidigm C1 system that is available for use on a for-fee, self-serve basis after training, with reagents purchased and samples prepared by the individual, as well as a 10X machine (droplet). HMS Single-Cell Core has a inDrop machine (droplet) that includes for-fee full service with faculty consultation.
What is the future for scRNA-Seq?
Bettering the way in which samples are processed and data is analyzed is a priority for scRNA-Seq experts. Specifically, ongoing work seeks to improve library preparation and sequencing efficiency. The programs used to process scRNA-Seq data are also still in flux so as to provide better normalization and correction tools for increasingly accurate data. On a larger scale, developing technology to analyze other biological aspects (genomics, epigenomics, transcriptomics) at the single cell level is of high interest, especially when considering how powerful combining these other forms of single-cell analysis with transcriptomics could be for understanding both normal and disease biology.
Resources:
- scRNA-Seq software packages: https://github.com/seandavi/awesome-single-cell
- Review of bioinformatics and computational aspects of scRNA_Seq: https://www.frontiersin.org/articles/10.3389/fgene.2016.00163/full
- Practical technique review: https://genomemedicine.biomedcentral.com/articles/10.1186/s13073-017-0467-4
- Start-to-finish detailed instructions on scRNA-Seq: https://hemberg-lab.github.io/scRNA.seq.course/biological-analysis.html