Debugging on VS Code (Mac)
Debugging on VS Code involves the following steps:
- Make sure “C/C++ IntelliSense, debugging, and code browsing” extension is installed in the SSH remote machine.
- Add a configuration: launch.json
- Set a breakpoint or set the “stopAtEntry” to true.
- Run the configuration.
Add a configuration: launch.json
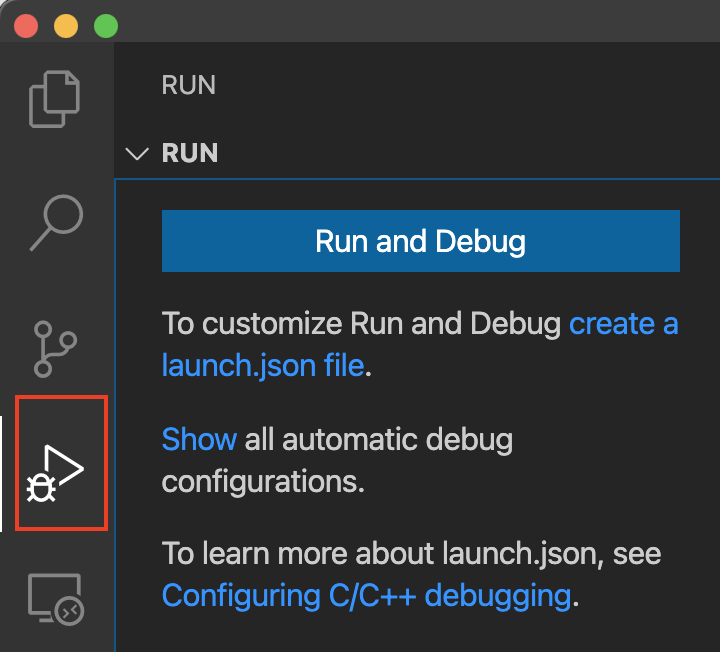
While selecting the .vscode on the left-navigation pane of the Explorer (Command+shift+e), enter Command+shift+d to enter into the “run and debug” set-up. Click on “create a launch.json file” and select “C++(GDB/LLDB)” from the environment menu selection. This will create a launch.json file and open it up for editing.
Change “program” to the program you intend to debug. For example, in your lab1, that would be “Array”. Change and save.
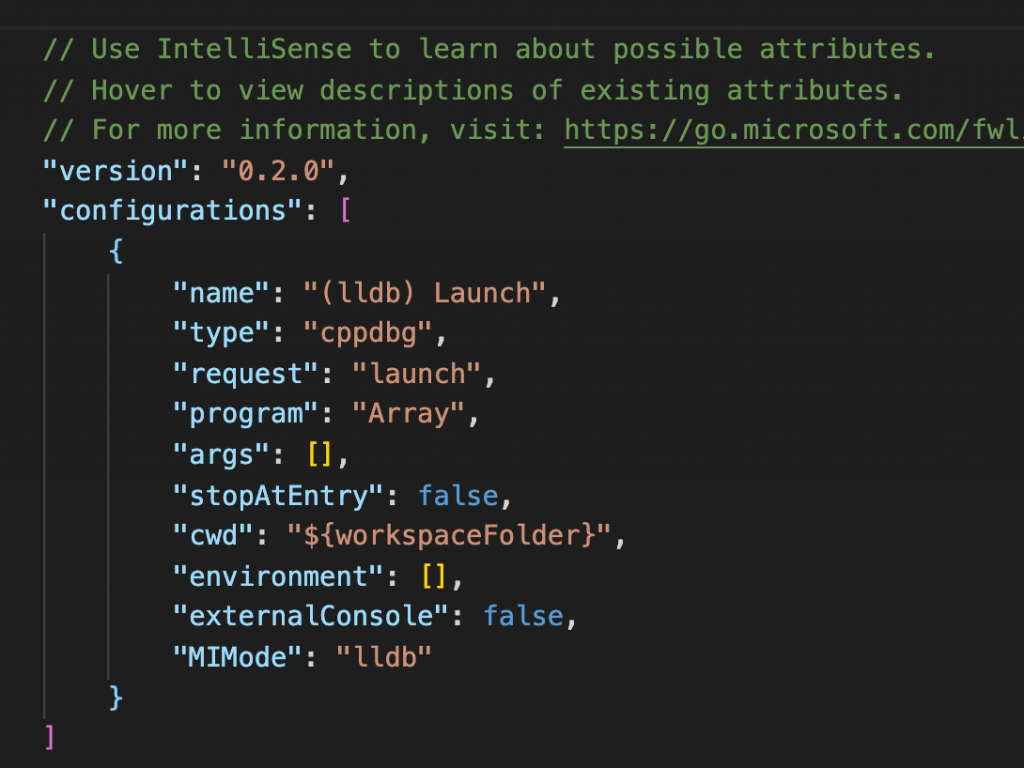
Setting the program field
Make sure to add the path to the executable as follows:
“program”: “${workspaceFolder}/Array”,
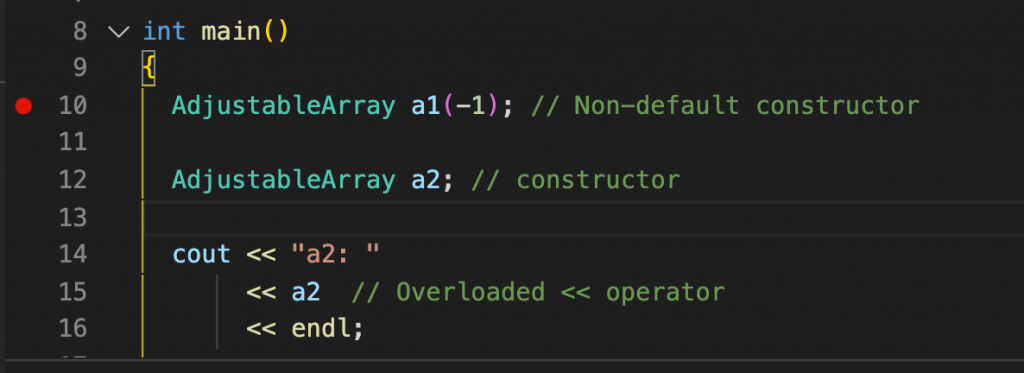
Set a breakpoint
Set a breakpoint by clicking next to a line where you want to set a breakpoint. Or, set “stopAtEntry” in the launch.json file to true to stop at the beginning of calling the main function.
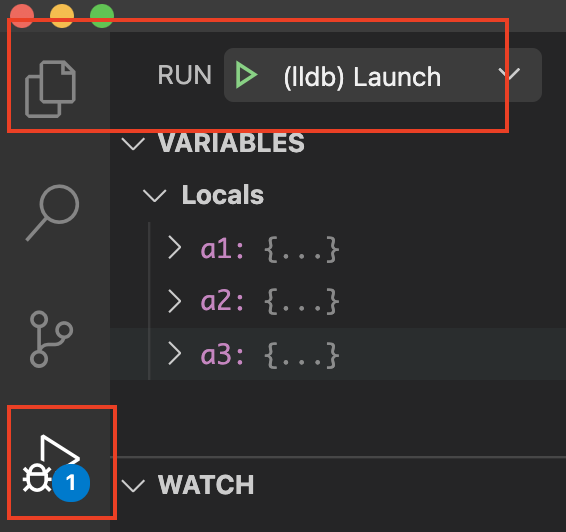
Run the configuration
Now, you are ready to run and debug.