
by Kyle Krell
The Pew Research Center says that “the basic goal of a good public opinion poll is to give everyone in the population, regardless of their wealth, age, education, race, knowledge of politics… an equal voice about the issues of the day.” Polls aim to be representative of and generalizable to the broader population, and pollsters expend lots of time and resources to ensure this happens.
However, there are different mechanisms that could bias data, weakening analyses of surveys, and one way is participants responding “Not sure,” “Don’t know,” “Prefer not to say,” or “Other” to individual questions–what I call DKNOs. Often, analyses of surveys invoke methods that remove these responses so only completed data remains. But this is a potentially problematic strategy; if certain people are more likely to respond DKNO to a question, then removing DKNOs would disproportionately eliminate some demographic of the population.
Previous research has demonstrated that this is an issue for DKNOs to policy-related questions. For example, based on data from the 1992 National Election Study (NES), there were seemingly many more people who supported government efforts to integrate schools than actually did. This is because over a third of respondents selected “Don’t know” to the question, and when removing these responses, the remaining responses were overwhelmingly supportive of such efforts. But many of these “Don’t know” respondents actually harbored anti-integration views and only chose the DKNO response over fears of being viewed unfavorably for their opinions. Factoring this in, there was really much more opposition to integration efforts at the time.
This research showed that DKNOs to policy questions may be systematically different in their policy views from the rest of the population, but what about DKNOs to non-policy questions? Interestingly, data from the 2022 Cooperative Election Study (CES) indicates that many respondents provide DKNO responses to simple demographic classification questions such as gun ownership, economic assessments, income, race, and home ownership. These respondents often have systematically different policy views than the rest of the population.
The CES surveys 60,000 Americans, asking a range of policy and non-policy questions. For policy areas, the study asks respondents if they support or oppose dozens of proposals related to the most pressing current political issues–including abortion, environment, gun control, healthcare, and immigration proposals. Using responses to these questions, I created a policy support score for each participant that measures their overall views on each of these five issues. The score ranges from 0 (most liberal) to 1 (most conservative) for each topic.

Among the non-policy questions, some have DKNO response options–either “Not sure,” “Don’t know,” “Prefer not to say,” or “Other”–these questions include the demographic classification questions above. The proportion of people who give such a response–the DKNO response rate–varies among these questions, but generally ranges between 2 and 8 percent. Race receives the fewest DKNO responses, at just under 2%, while income receives the most with over 8%. Extrapolating to the entire US population, this would suggest that roughly 6.4 million Americans would respond “Other” to their race and around 25.6 million Americans would respond “Prefer not to say” to their income. So even though these percentages are small, this impacts a substantial number of people.
It is customary for analysts to discard DKNO responses from their calculations, but doing this relies on the assumption that DKNO respondents are a random subset of the population. However, that is not the case.
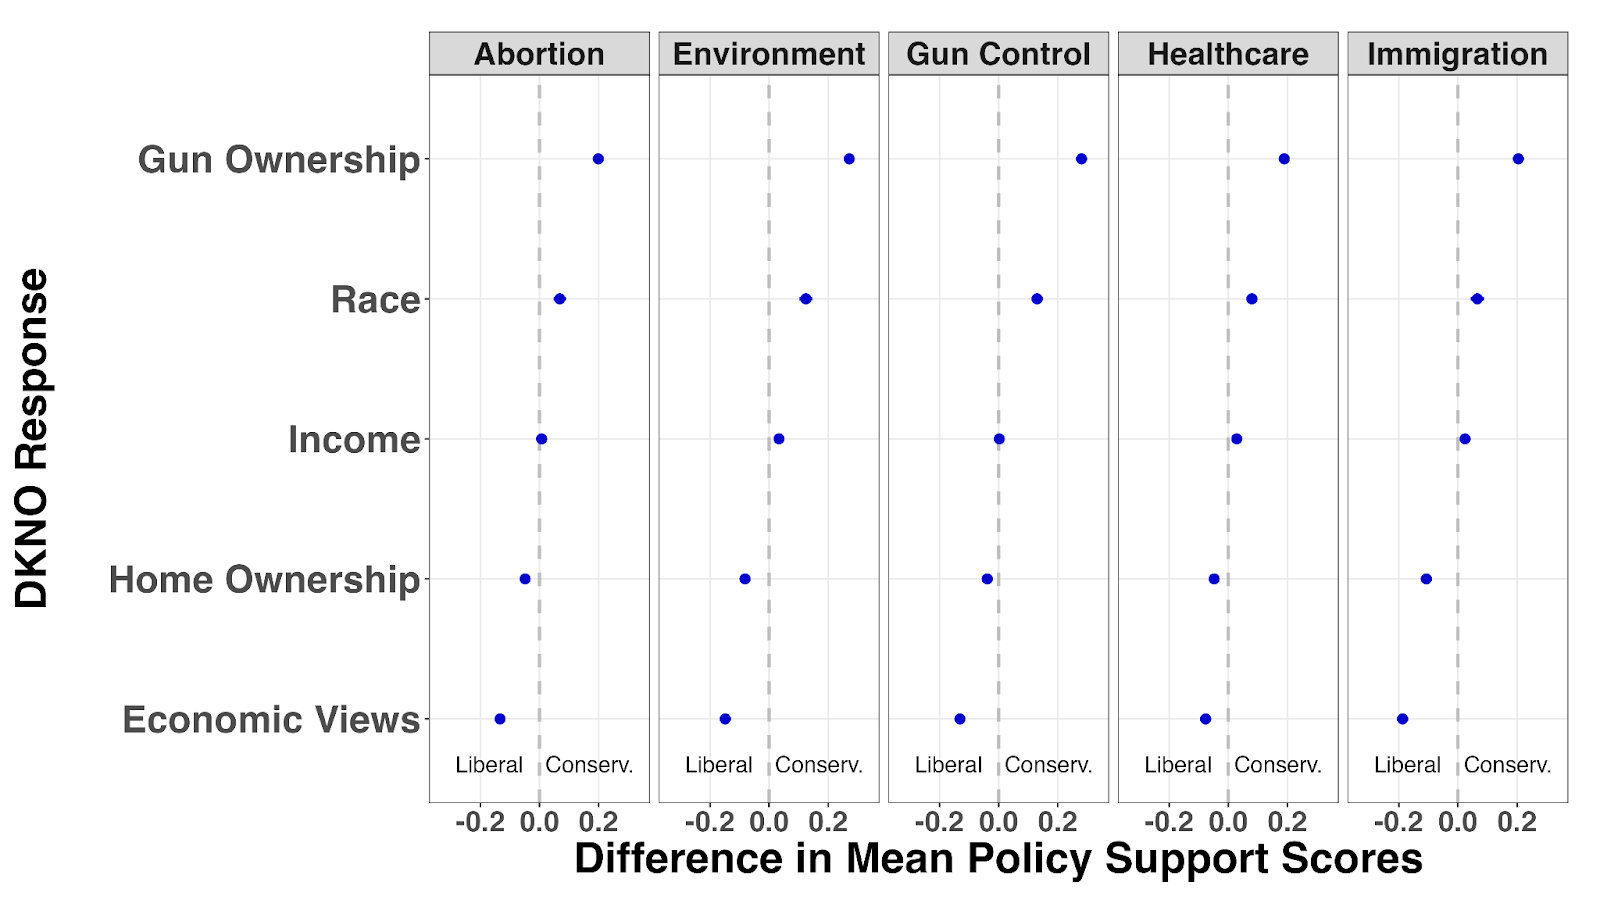
I find that, across all issues, people who respond “Not sure,” “Other,” or “Prefer not to say” to questions about their gun ownership, economic views, income, race, and home ownership have significantly different policy views compared to those that give any other response. Specifically, “Not sure” respondents to gun ownership status and “Other” respondents to race are substantially more conservative, and those who say “Not sure” about economic views are substantially more liberal. Those who select “Prefer not to say” for their income are more conservative, but only slightly, and those who respond “Other” for their home ownership status are slightly more liberal.
The magnitude of the difference in policy views for gun ownership and economic views DKNOs is striking. Gun ownership DKNOs have a policy support score that is 19 to 28 points more conservative across all issues. Economic views DKNOs are between 8 and 19 points more liberal, also a substantial difference. For reference, self-identifying liberals have policy support scores approximately 50 points lower than self-identifying conservatives, so the difference in policy views for these DKNOs is quite stark.
This indicates that people who respond DKNO to these simple classification questions are significantly different in their policy views compared to the rest of the population, so there is likely some underlying explanation for why certain people are more likely to give a DKNO response to these questions. Importantly, this also means that analysts should not delete from their data DKNO responses to questions about gun ownership, economic views, income, race, and home ownership because these responses are not random.
Why are DKNOs so different in their policy views? There is some previous research that provides potential explanations. It may be that people that respond “Not sure” about their gun ownership status actually do know their status, and they themselves are gun owners. But since they are skeptical of political institutions, they do not want to reveal information about their gun ownership status in a survey. These people are generally more conservative, which could explain why gun ownership DKNOs are so much more conservative on average.
Also, previous research has shown that state economic perceptions are closely tied into partisan biases. One potential idea is that participants may opt to not respond to questions about their views on the economy if their opinions conflict with their partisanship. Essentially, if someone believes the economy is performing poorly but the president is from their party, then they may not want to respond so as to not express disapproval of their party. The “Not sure” option offers an easy neutral answer to respondents, so some people may use that as a way to hide their true opinions. Since the survey comes from 2022 with Joe Biden as president, some liberals may have responded DKNO if they believed the economy was doing poorly but did not want to display disapproval of President Biden, potentially causing economic views DKNOs being more liberal on average.
If this is an issue for analysis, then what can be done about it? The answer probably should not be to remove DKNO options from survey questionnaires. While these options can pose challenges for analysis, they are still crucial for allowing people the opportunity to select the answer that fits them best and carry valuable information. Instead, analysts should adjust their methods to better account for such responses on non-policy questions. Listwise deletion and other types of deletion can bias results when the missing data is systematically different from the observed data, but there are other ways, such as imputation, to account for missing data that do not make as extreme assumptions about the data. For example, the Pew Research Center often handles missing data using a similar approach with multiple imputation by chained equations (MICE).
What is clear from my research is that the DKNO respondents often have quite distinct political views and researchers who exclude them from their analyses do so at their own peril.