Recently, I was tasked with looking into the political opinions of blood donors in the Cooperative Election Study (CES) when I noticed that our demographics were off. Our sample showed that 53% of blood donors were men, but the data from America’s Blood Centers indicated that the actual proportion was only 46%. Men seemed to overreport lots of the behaviors I looked at, leading me to investigate this further — interestingly, men appear to lie more than women on surveys, which I dug into here. Curious if this was a one-off issue, I checked our crime victim sample — 13.5% Black versus the FBI’s Uniform Crime Report showing 26% Black victims.
The CES has a very large sample, which creates a tendency among researchers to study small subgroups using this survey. For example, the 2024 survey includes 5,157 respondents who said they donated blood during the past year. It is tempting to focus on this group of respondents and treat them as if they are a representative sample of blood donors, but that is not necessarily the case.
Survey weighting is a statistical technique used to ensure that sample data, like the CES, accurately represents a target population. In any survey, certain demographic groups may be over or underrepresented in the respondents due to sampling methods, response rates, or other factors. Weighting corrects these imbalances by assigning each respondent a numeric value (weight) that indicates how many people in the population they represent, allowing researchers to use their data to make assumptions about the general population, not just their respondents.
The CES data is weighted to ensure that it is demographically and politically representative of the American adult population as well as of each state’s population, but that does not necessarily ensure that subgroups, especially small subgroups, will be representative.
Fortunately, researchers can easily make their own adjustments to the existing weights when they are interested in studying particular subgroups and when there are known demographic targets for those groups. In this post, I outline this process, including how I applied it to five different subgroups in the CES.
Data
I focused on CES data from 2016 to 2024, examining multiple survey waves to ensure substantial sample sizes. Adequate sample sizes are critical for two main reasons: First, they provide sufficient cases across all demographic categories we’re weighting to (like having enough respondents in each age/race/gender combination), preventing any single respondent from receiving an extreme weight that could skew results. Second, larger samples reduce statistical noise, allowing for more precise and stable weight calculations that better represent the true population. For this analysis, I developed specialized weights for five distinct groups (as they had reliable demographic data available): blood donors, military personnel, crime victims, college students, and federal employees.
The original CES weighting process is already quite sophisticated, using a two-step approach. First, they weight the completed cases to their sampling frame using entropy balancing — a method that adjusts weights to match multiple population characteristics simultaneously while minimizing information loss. This balancing matches distributions on gender, age, race, Hispanic origin, education level, and 2020 presidential vote choice and turnout.
These weights are then refined through raking (iterative proportional fitting), which sequentially adjusts weights across demographic dimensions such as age, gender, education, race, “born again” status, voter registration status, and 2020 Presidential vote choice. Unlike entropy balancing, raking adjusts one dimension at a time in multiple passes until convergence.
Rather than discarding the CES weights, our specialized weights use these as a baseline, preserving the political and demographic balancing while adding targeted adjustments for these specialized populations. This approach leverages the calibration already done by CES for national and statewide representativeness, while avoiding potential overfitting to our specific subpopulations that might sacrifice other essential dimensions.
For each of the five groups, I established specific demographic targets based on reliable sources. I made sure to use targets from years close to the survey years being analyzed — never using targets more than four years away from the survey data. This approach ensured that the weights accurately reflected the population characteristics during the study period. The dimensions chosen for each group were determined by the available data:
For blood donors, America’s Blood Centers data provided gender distributions (Male, Female), along with breakdowns by race (White, Black, Hispanic, Asian, Other) and age categories (18-24, 25-64, 65+) in 2022 and 2024, enabling us to create reliable weights spanning the 2018-2024 period.
Crime victim targets from the FBI’s Uniform Crime Report included gender information (Male, Female, Other), racial composition (White, Black, Asian, and Other), and detailed 5-year age brackets from 18 to 65+, allowing for comprehensive weight development across the entire 2016-2024 timeframe.
Federal employee demographics from FedScope/OPM data encompassed gender (Male, Female), education levels ranging from no high school through college graduates, racial and ethnic composition (White, Black, Hispanic, Other), age groupings (Under 30, 30-49, 50+), and regional distribution between the DMV area (DC/MD/VA) and other locations. Since the CES only included federal employment questions in 2022 and 2024, our specialized weights are limited to these two survey years.
Military personnel targets derived from Military OneSource statistics included gender proportions (Male, Female), separate dimensions for race and Hispanic ethnicity, age categories (18-25, 26-30, 31-35, 36-40, 41+), and five education levels from less than high school through post-graduate studies, supporting weight creation for the entire 2016-2024 period.
For college students, I developed targets based on data from the 2023 American Community Survey (ACS), which provided gender distribution (Men, Women), racial composition (White, Black, Hispanic, Asian, Other), and age categories (18-22, 23-29, 30-39, 40+), supporting the creation of these specialized weights in 2020, 2022 and 2024.
Raking and implementation
With targets established, I implemented an iterative raking process (also known as iterative proportional fitting) to adjust the weights until sample proportions matched target distributions. Iterative raking works by cycling through population parameters repeatedly, making smaller and smaller adjustments with each pass until reaching the desired level of accuracy.
I began with existing CES weights and calculated the current weighted proportion for each demographic category. The raking process then sequentially adjusted these weights across all dimensions. For each category, such as “Male” within gender, I calculated an adjustment factor by dividing the target proportion by the current proportion. All weights for respondents in that category were multiplied by this factor. For example, if male blood donors should be 46% but were currently 53%, the adjustment factor would be 0.87, reducing their representation. This approach ensures the weighted sample proportions gradually move toward the target population proportions.
The challenge in this process is interdependence — adjusting gender weights affects racial distribution, requiring race weight adjustments, which then affect gender distribution again. To address this, I ran multiple iterations without any predetermined limit, continuing until stability. In this context, stability means the sample proportions were within 0.2% of all target proportions — our convergence threshold. At this point, additional iterations would produce only negligible changes in the weights, and all demographic dimensions simultaneously match their targets within this specified tolerance.
For implementation, I used a weight cap of 15, meaning no individual weight could exceed five times the average weight. This prevents extreme weights that could make estimates unstable by giving too much influence to a small number of respondents or one specific respondent.
Once the weights converged, I normalized them by dividing by their mean, centering them around 1.0. Normalization is standard practice in survey weighting as it ensures the weighted sample size approximately equals the actual sample size. Without normalization, the sum of weights might inflate or deflate the effective sample size, complicating inferences.
Why does any of this matter?
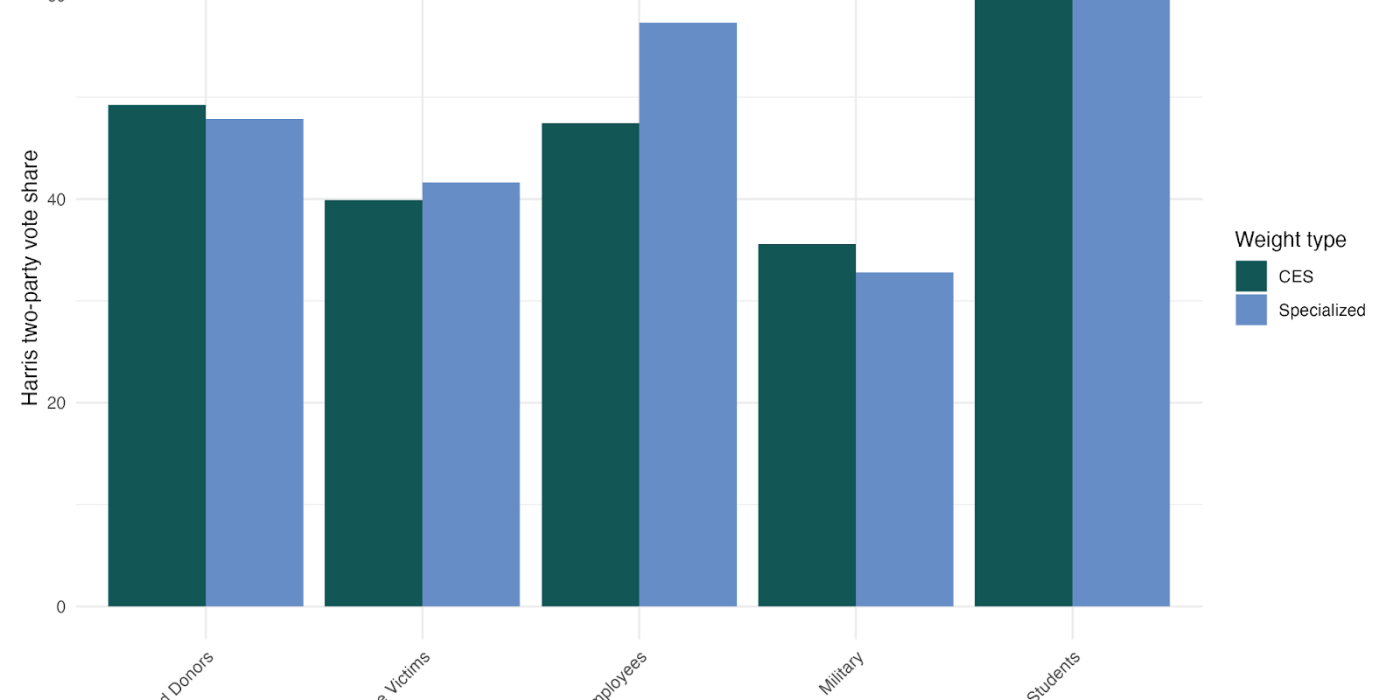
To demonstrate the real-world impact of these specialized weights, I applied both the original CES weights and our new specialized weights to analyze Democratic presidential vote share and ideological distribution across all five demographic groups.
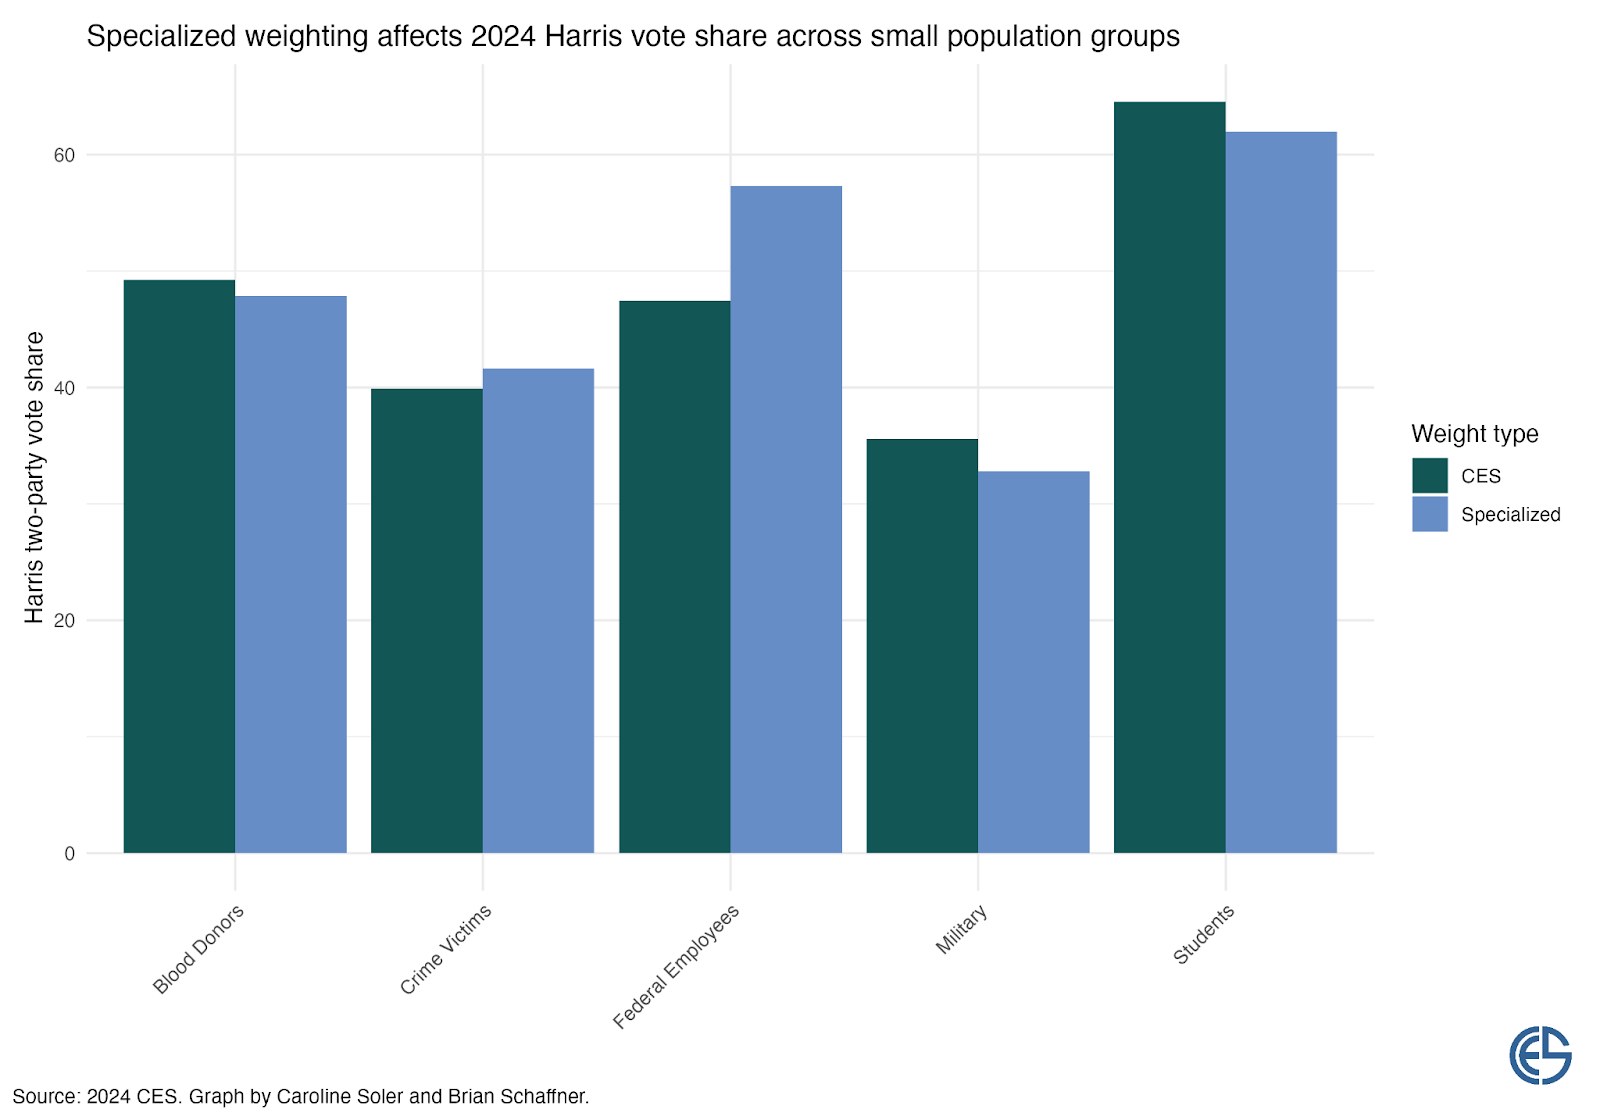
The results reveal consequential differences that challenge conventional understandings of these populations’ political preferences. Blood donors appear slightly more Democratic-leaning with standard weights (49%) than with specialized weights (48%). Crime victims show a small increase in Democratic support when properly weighted (42% vs 40% with standard weights). College students also demonstrate a shift, voting about two percentage points more conservative when specialized weights are applied.
Most striking are the patterns for federal employees and military personnel. Federal employees demonstrate a dramatic reversal of perceived preferences — standard weights suggest relatively balanced partisan preferences (48% Democratic vote share), but specialized weights reveal they actually strongly support Democratic candidates at 57%. This 9-point difference fundamentally changes our understanding of this influential population’s political orientation.
Conversely, military personnel — already the most Republican-leaning group in our analysis — show even stronger conservative tendencies when properly weighted, with specialized weights showing significantly lower Democratic support (33%) than standard weights (36%).

The ideological distribution for military personnel provides perhaps the clearest illustration of how standard weighting can mischaracterize group attitudes. Using specialized weights reveals military personnel to be substantially more conservative (53%) than CES weights indicate (43%) — a difference of over 10 percentage points. Both liberal (21% vs 26%) and moderate (26% vs 32%) identification are lower with specialized weights. This substantial ideological gap confirms that properly weighted data reveal a military population that is significantly more conservative than our standard survey methods suggest.
Without specialized weighting, researchers risk fundamentally misunderstanding the behaviors and preferences of these groups. As these findings demonstrate, the political leanings and many other attitudes of these populations can be entirely misrepresented when using standard survey weights. Such mischaracterizations matter because they affect how we interpret group-specific attitudes and behaviors, potentially leading researchers to incorrect conclusions about the very populations they aim to study.
My dataset with the specialized weights for these five demographic groups is available on the Dataverse here. The dataset includes case ID and year for each respondent, specialized weight variables for each of the five demographic groups, and documentation on proper merging and implementation. Users can easily merge this with existing CES datasets by matching on year and case ID, then apply the appropriate specialized weight variable when analyzing these specific demographic groups.
For those interested in developing specialized weights for other populations beyond the five covered here, this methodology provides a blueprint. The essential requirements are access to reliable external benchmarks for your population of interest, a sufficient sample size within your survey data, and demographic variables that align between your survey and benchmark data. By implementing specialized weighting for subpopulations in large surveys, researchers can substantially improve the accuracy of their analyses, avoid misleading conclusions, and develop more reliable insights into the attitudes and behaviors of various groups.