by Caroline Soler, Brian Schaffner, and Stephen Ansolabehere
Earlier last month, David Shor, now a data scientist at Blue Rose Research and someone who has drawn a lot of attention as an influential figure in Democratic politics, spoke on Ezra Klein’s podcast. He promoted the bold idea, based on his research at Blue Rose, that most groups of young Americans backed Trump in the 2024 election.
During his conversation with Klein, Shor shared evidence that Trump won among white men, white women, and men of color under 26, while Harris only secured majority support from women of color in this age group. “Among 18-year-olds, women of color are the only of the four that Harris won,” Shor explained, “Trump narrowly won nonwhite men,” suggesting a significant realignment among young voters that contradicts long-held assumptions about the Democratic party’s strength with young voters.
This finding has generated a great deal of buzz. After all, it would mark a reversal of voting patterns that have been consistent for decades. But how confident should we be in these patterns? Young voters are notoriously difficult to poll accurately. They’re less responsive to surveys, more mobile (frequently changing addresses), and have inconsistent turnout patterns. Notably, three of the major surveys of American elections — the Cooperative Election Study (CES), AP VoteCast, and CNN exit polls — fail to corroborate what Shor is presenting.
Other surveys tell a different story
Three publicly available data sources with large voter samples allow us to study the groups Shor referenced. The CES includes 60,000 adult respondents pre- and post-election, the National Election Pool exit poll sampled 22,966 voters at polling locations plus early and mail voters, and AP VoteCast surveyed around 139,938 respondents before the election.
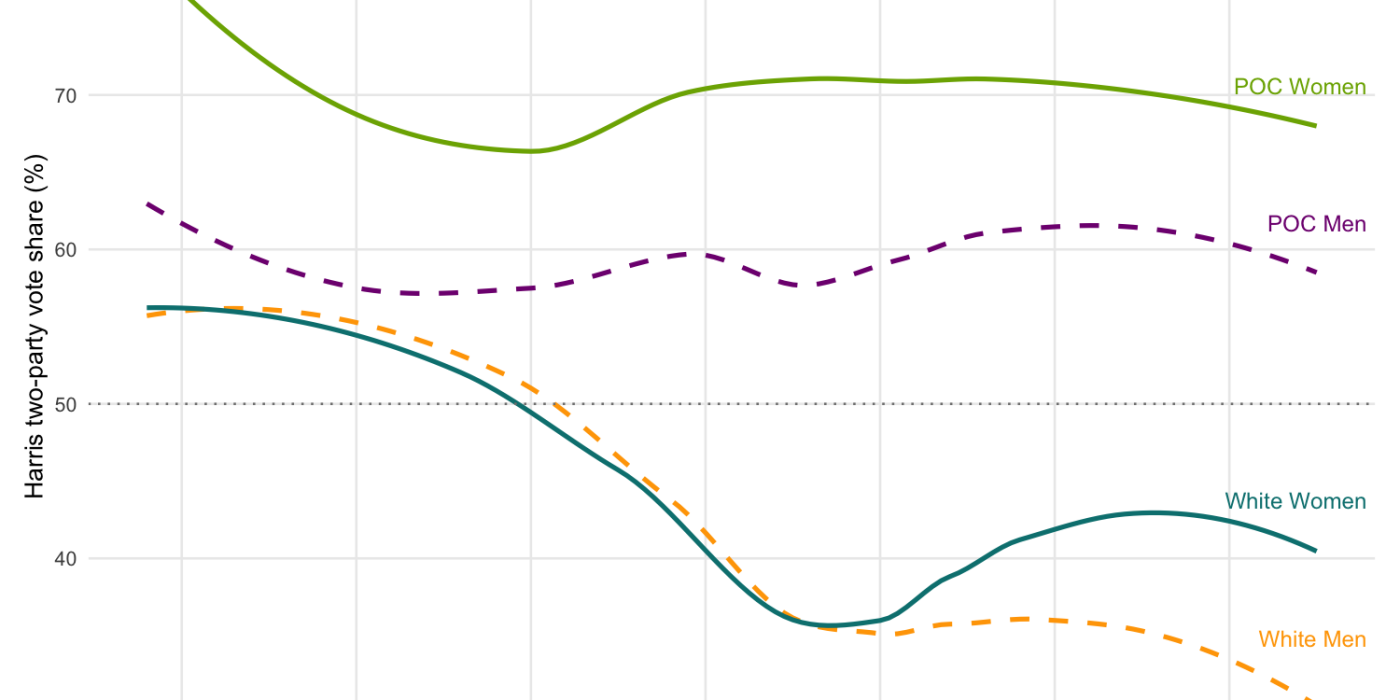
We began by reproducing Shor’s graph using the CES and VoteCast survey data, as shown below, since the raw data was available for both surveys. VoteCast provides data on age in groupings, with the youngest grouping representing 18–24 year olds. Among 18–24 year olds, VoteCast shows that Trump only won among white men. Harris’s support was 57% among white women, 58% among men of color, and 76% among women of color, 5–15 points more Democratic than Shor’s data.
The CES data shows similar discrepancies. Among 18–25 year olds who voted in 2024, 56% of white women voted for Harris and 61% of men of color supported the Democratic nominee — again, a 5–15 point difference with Shor’s data. However, the results are consistent for women of color, with between 70 and 80 percent of this group voting for Harris in each survey.
Young white men present the only area of potential agreement with Shor’s analysis, but even here, the picture remains complex. VoteCast shows Trump winning 35% of the vote among 18–24 year old white men. This is in line with Shor’s data, though he has Trump doing even better among young white men. However, the CES suggests a different trend, with Harris getting 56% support among these voters.
This divergence for young men reinforces the challenges in polling this demographic. No single survey provides a perfect picture, and these variations underscore why we should be cautious about claims made about young voters from any single data source.
While the CES and VoteCast data already raise serious doubts about Shor’s claims, we also examined exit polls to provide an additional perspective. While we lack access to their raw data to fully reproduce results by race and gender, the exit poll data casts further doubt on Shor’s claims.
According to the exit polls, Harris received 48% of the vote among 18–24 year old white voters. While the exit polls do not yet break this out by gender, the only way for a majority of white women to have supported Trump would be if there was essentially no gender gap among this age group. The exit polls show that 18–29 year old white women went 54% for Harris while 18–29 year old white men went 53% for Trump. If 18–24 year old white men and women both split exactly 48% for Harris, then to maintain the overall vote share for 18–29 year olds, white men aged 25–29 would need to vote 41% for Harris, while white women aged 25–29 would need to vote 62% for Harris. Not only are these gender and age gaps implausible, but this 62% is much higher than what any data source (including Shor’s) reported for this group.
The exit poll data doesn’t isolate all people of color, but we can see patterns for the two largest non-white groups. Harris won 52% among 18–24 Latino voters and 88% among 18–24 Black voters. Among 18–29 year olds, she won 77% of black men but just 40% of Hispanic male voters. Even with Hispanic men outnumbering black men among 18–24 voters, it would still take a dramatically good performance by Trump among young Hispanic men to push toward a Trump victory among young voters of color.
Based on these three high-quality data sources, it appears very unlikely that “only women of color” backed Harris among voters under 26. Despite methodological differences, the data from all three sources tell a story of continued Democratic strength with young voters, with some variation by race and gender. Still, nowhere near the dramatic realignment Shor described.
Polling young people is tricky
While the CES, VoteCast, and Exit Poll tell a consistent story about Harris winning a majority of young white women and voters of color, even these sources sometimes provide disparate estimates. Two major issues plague polling of young voters. First, young voters are notoriously difficult to survey, with especially low response rates among young adults.
Second, even once pollsters have successfully recruited young people into their surveys, knowing which ones will actually vote can be difficult. In most presidential elections, less than half of young adults turn out to vote, yet most young survey respondents claim they will vote (or did vote when asked afterward). The CES matches respondents to vote files to confirm turnout. While this process hasn’t been completed for 2024, we can learn from the 2020 cycle.
In the 2020 CES, 53% of 18–25 year old men of color said they voted when they had not. For some groups, those misreporting voting were more likely to be Trump supporters. White women under 26 who claimed to vote when no record existed were more supportive of Trump by 10 percentage points than actual voters. Similar patterns appeared for young white men.
Of course, each survey employs a distinct methodology with specific data adjustments. VoteCast implements a sophisticated likely voter model to predict who will vote. Exit polls interview voters as they leave polling places to ensure they’re capturing actual voters. The CES matches its data against voter records to generate estimates based on validated voters. There is less public information about Blue Rose Research’s methodology or weighting procedures, so it is harder to discern why the data Shor cites appears to be so different from these other sources. As Klein himself wrote, “Shor doesn’t really show his work.” [Addendum: Shor has since pointed us to several videos that go into further depth on Blue Rose’s methodology. You can find those here, here, and here.]
Given the challenges in polling young voters, the best advice is to be skeptical of any one polling source and instead attempt to see what a collection of high-quality surveys have to say. In this case, Shor’s claims about young white women and men of color supporting Trump are simply not supported by the best public data available.