
by Caroline Soler
An important asset of the Cooperative Election Study is its detailed set of questions about religion. The survey provides detailed information about Americans’ religious denominations, behaviors, and beliefs for a large sample of Americans on an annual basis, making it an invaluable resource for scholars studying the intersection of religion with politics and society. But how accurate is the CES at capturing America’s religious landscape?
An important benchmark in this area is Pew’s Religious Landscape study. However, until recently the last such study was conducted in 2014, making it outdated as a reliable point of comparison. Fortunately, Pew recently released the results from an updated Religious Landscape Study carried out in 2023 and 2024.
My results reveal that the 2024 CES demonstrates impressive overall precision in measuring America’s religious diversity, with most differences falling within three percentage points and many categories showing near-perfect alignment. However, a consistent pattern emerges: the CES captures a slightly more secular America across virtually every measure of religious belief and practice. Even more telling, these patterns are nearly identical to what we found in 2022, suggesting systematic rather than differences particular to the 2024 CES. While the CES excels at measuring most aspects of religious life, these slight but persistent differences are important to note for researchers studying not only religious demographics but also the political attitudes and voting behavior that the CES is designed to measure.
About the Cooperative Election Study
The CES is the largest academic survey focused on American elections. Since 2006, the study has interviewed more than 700,000 Americans to capture their views on contemporary policy debates, their engagement in political and social life, and their vote choices in federal and state elections. In 2024, the survey included interviews with 60,000 American adults before and after the election, with the data collection carried out by YouGov. The CES asks detailed questions about religious identification, importance, attendance, and prayer frequency using question wording designed to match Pew’s approach, which makes these direct comparisons possible.
About Pew’s 2023-2024 Religious Landscape Study
Pew’s Religious Landscape study is quite comprehensive – including interviews with almost 40,000 U.S. adults from a geographically stratified address-based sample of over 200,000 addresses. They offered multiple completion options (online, mail, and phone) and collected data from July 2023 through March 2024, and administered the survey in both English and Spanish.
It’s worth noting that there are some differences between these surveys. Pew uses more specific denominational categories in its religious identification question, offering detailed examples. For example, the CES simply offers “Protestant” as a response option to the question asking “What is your present religion, if any?”, but Pew lists the response option as “Protestant (for example, Baptist, Methodist, non-denominational, Lutheran, Presbyterian, Pentecostal, Episcopalian, Church of Christ, Congregational or United Church of Christ, Holiness, Reformed, Church of God, etc.).” They also note “Please specify” after their “Something else” option, whereas the CES simply provides respondents with the option to type in an answer, likely capturing more nuanced responses than the CES does.
Religious identification
The CES demonstrates remarkable accuracy in capturing America’s diverse religious landscape. Looking at the complete religious picture, most faith traditions show strikingly similar estimates between the two surveys. Among non-Christian religions — including Jewish, Muslim, Buddhist, and Hindu Americans — both surveys produce nearly identical figures. Catholics show exceptional alignment, as do Atheists and Agnostics. The combined “Other Christian” category (including Mormons and Orthodox Christians) also demonstrates close correspondence between the surveys. This overall precision underscores the CES’s strength in measuring religious diversity across the vast majority of faith communities.
However, one notable exception emerges: the most striking difference between the CES data and Pew’s is the underrepresentation of Protestants in the CES sample. The CES shows 34.9% of Americans as Protestant versus Pew’s 40% — a gap of 5.1 percentage points.
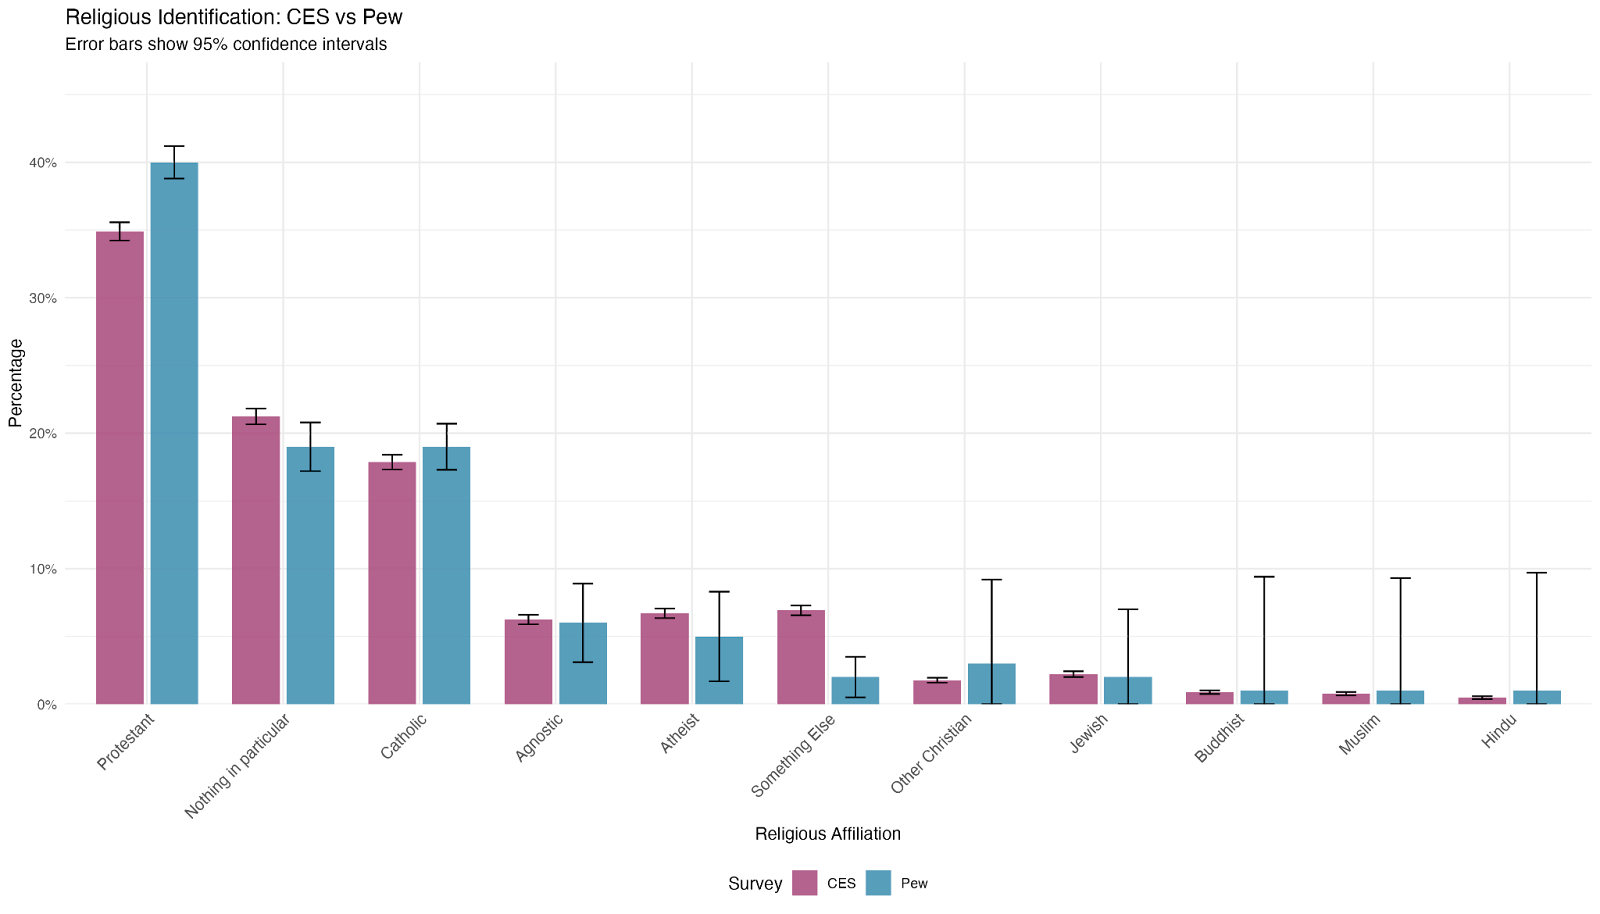
Where do those “missing” Protestants show up in CES data? Likely in those who identify as “Nothing in particular” (the CES shows 21.2% versus Pew’s 19%) and “Something Else” (6.9% versus 2%), both representing statistically significant differences between the surveys.
The “Something Else” category deserves special attention. In the CES, 8.5% of Americans initially identified as “something else.” While some respondents elaborated on their response in the accompanying text box, many did not and others provided only vague responses. I have recoded these responses by hand (researchers can find this data here), but even after doing so, there were still 6.9% of Americans for whom it was not possible to identify a more specific category for that respondent.
Pew follows a similar recoding process for their “Something Else” designations. When Pew’s respondents initially select “something else,” they’re forced to specify further, and many provide answers that allow Pew to place them in existing categories. In Pew’s surveys, the final “Something Else” category typically represents only 1-2% of all respondents — comprising smaller religious groups like Sikhs, Baha’is, and Rastafarians, as well as those identifying as “spiritual but not religious” or having their “own beliefs.” The CES’s less intensive follow-up process may be leaving more respondents in this catch-all category who could otherwise be classified as Protestant or another established religious group.
Protestant traditions
When examining the breakdown of Protestant traditions, evangelical Protestants show the largest gap, with CES data underestimating this group by 2.0 percentage points (21.0% versus 23.0%). Mainline Protestants and Historically Black Protestants show similar estimates in both surveys.
Despite the underrepresentation of evangelical Protestant denominations overall, the CES overestimates the proportion of Americans who self-identify as “born-again/evangelical” by 4.0 percentage points (33.0% versus 29.0%). This seemingly contradictory finding reflects the difference between denominational affiliation and personal religious identity. The first measure captures those who belong to formally evangelical Protestant denominations (such as Southern Baptist and Assemblies of God), while the second captures anyone across all religious backgrounds — including Catholics, mainline Protestants, and others — who personally identify with evangelical or born-again labels. This pattern suggests that while fewer CES respondents affiliate with evangelical Protestant denominations, more identify personally as evangelical regardless of their formal religious affiliation. It’s a reminder that religious identity operates on multiple levels that don’t always align perfectly.
Church attendance, religious importance, and prayer frequency
The CES overestimates the number of individuals who “seldom/never” attend religious services, showing 53.9% compared to Pew’s 49.0% — a difference of 4.9 percentage points. Meanwhile, the CES underestimates those who attend “a few times a year” by 5.1 points (12.9% versus 18.0%).
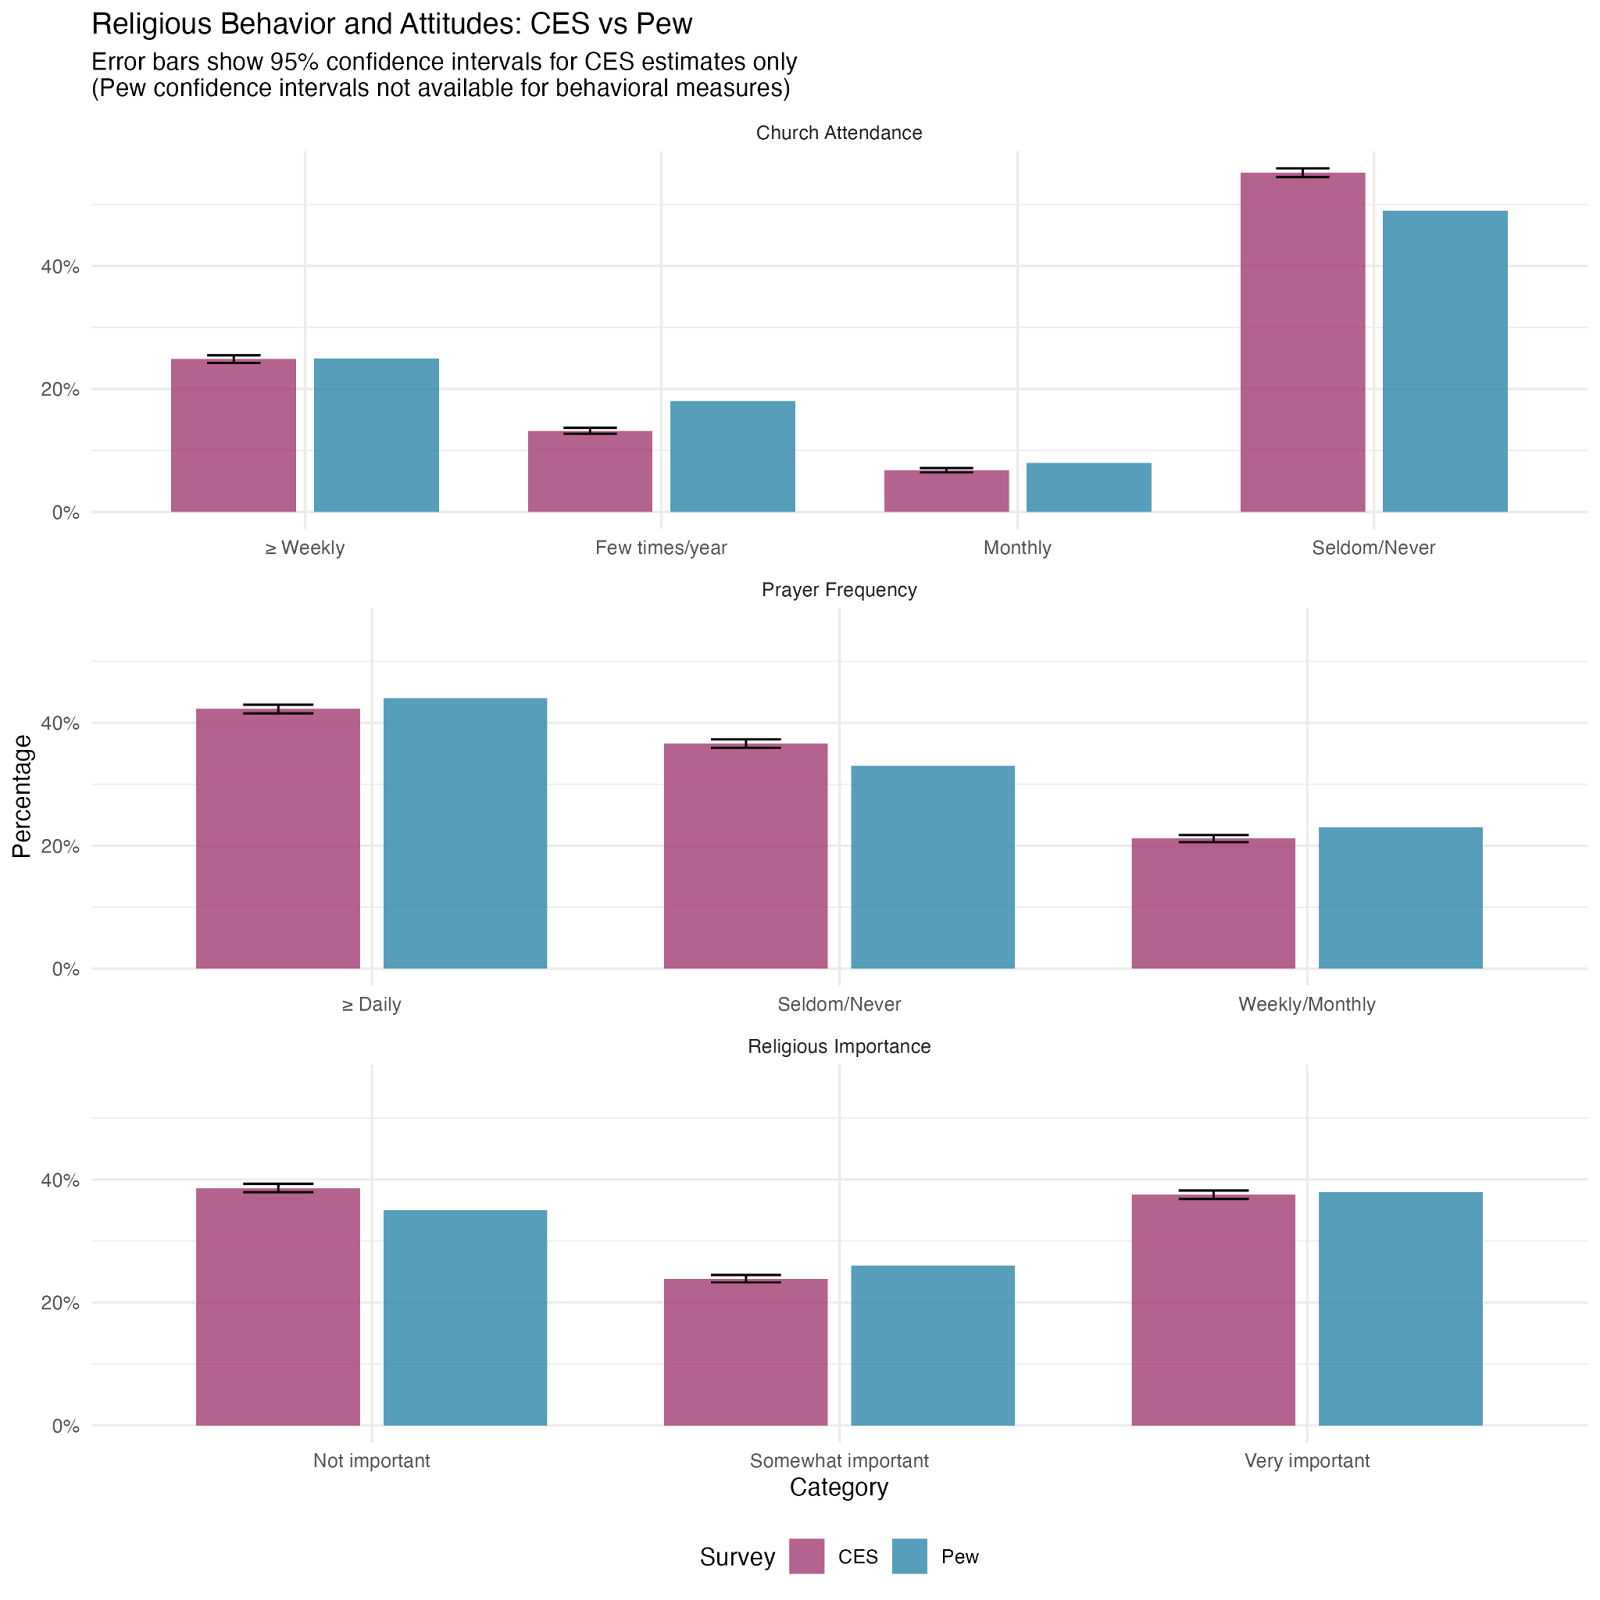
The secular bias extends to how Americans view the importance of religion in their lives. The CES overestimates the proportion who consider religion “not important” by 3.6 percentage points (38.6% versus 35%) while underestimating those who view it as “somewhat important” by 2.1 points (23.9% versus 26%). Prayer frequency follows the same pattern. The CES underestimates daily prayer by 3.0 percentage points (41% versus 44%) and those who pray “weekly/a few times a month” by 2.5 points (20.5% versus 23%), while overestimating those who “seldom/never” pray by 2.6 points (35.6% versus 33%).
However, the most committed religious Americans show remarkable alignment. Weekly attendance shows striking correspondence between the surveys, with only a 0.7-point difference (24.7% in CES versus 25% in Pew). The pattern extends to monthly attendance, where the CES shows 8.5% attending “once or twice a month” compared to Pew’s 8.0% — a very close alignment. Breaking down religious importance further, the “very important” category shows the same gap of 0.5 points (37.5% versus 38%).
The consistency of these patterns across all three measures — attendance, importance, and prayer — suggests systematic rather than random differences in how the CES captures America’s religious engagement. The CES accurately captures the most committed religious Americans, with weekly attendance, weekly prayer, and those who view religion as “very important,” showing agreement with Pew. However, the CES overestimates America’s least religious populations — inflating the numbers of those who seldom or never attend services, rarely pray, and consider religion unimportant. This consistent pattern suggests the CES is capturing a more secular America than actually exists.
Religious-ideological correlations
While the CES demonstrates general accuracy in capturing America’s religious landscape — with most differences falling within just a few points between the surveys and many categories showing almost the exact same estimates — a crucial question remains: Do religious measures correlate with political attitudes similarly across both surveys? This represents another important test of the survey’s accuracy, examining not only demographic representation but also the intersection of religion and politics in America.
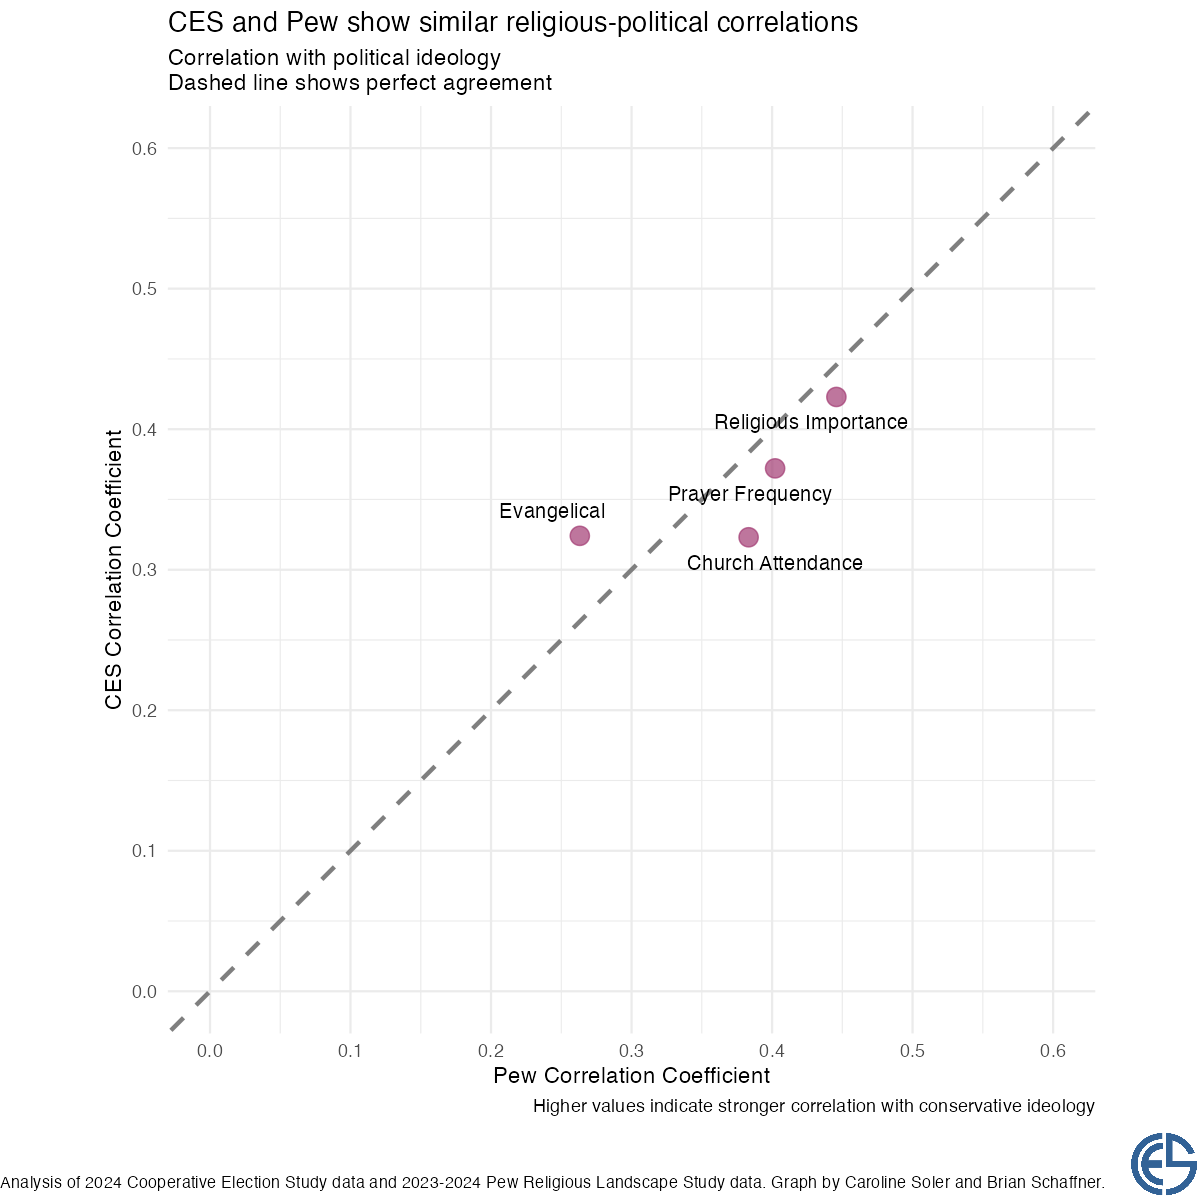
The answer is essentially yes. When examining the correlation between religious measures and political ideology, both surveys reveal strikingly similar patterns. Religious importance shows the strongest correlation with conservative ideology in both datasets (0.42 in CES versus 0.45 in Pew), followed by prayer frequency (0.37 versus 0.40) and church attendance (0.32 versus 0.38). Even evangelical identification correlates with conservative ideology at similar levels (0.32 in CES versus 0.26 in Pew).
These correlational patterns reflect some of the most fundamental dynamics in American politics: how personal faith translates into political identity, how religious practice influences voting behavior, and how theological beliefs shape policy preferences. The fact that both surveys capture these relationships so similarly suggests that while the CES may capture a slightly more secular America across multiple measures of belief and practice, it accurately reflects what matters most for political research: how those religious identities shape political behavior.
Conclusion
Overall, the CES provides estimates that are quite similar to Pew’s Religious Landscape Study, with most religious categories showing alignment within just a few percentage points. However, there are some relatively small differences that researchers should be cognizant of, particularly when it comes to religiosity and Protestantism. The CES consistently portrays a slightly more secular America — underestimating Protestant affiliation, church attendance, prayer frequency, and religious importance while overestimating those who are least religiously engaged. These patterns are persistent across multiple measures and mirror the same trends from 2022, suggesting systematic rather than random differences. While important to acknowledge, these biases do not undermine the CES’s fundamental value in capturing how religious identity shapes political behavior in contemporary America.