

Home > Off the Charts > Uneven State of the Union
The Big Easing: Re-Open in Haste, Repent at Leisure?
Summary
While contingents push to re-open, states have begun to reverse course as the virus surges to new heights. States with better digital readiness possess the capacity to endure longer periods of lockdowns, and those continuing to observe strict social distancing measures are better prepared to arrest COVID-19 transmission.

Key Observations and Insights
In the first phase of our research, we examined how states differed in their responses to and containment of COVID-19 (COVID Reflex). This was followed by an in-depth analysis of how states compare in their digital readiness—a composite measure of work from home capabilities as well as inclusive internet access and digital public services (Digital Reflex). In light of the patchwork pandemic, we now revisit the Digital and COVID Reflexes to explore how states chart their own re-opening paths amid significant pressure to kick-start economic recovery.
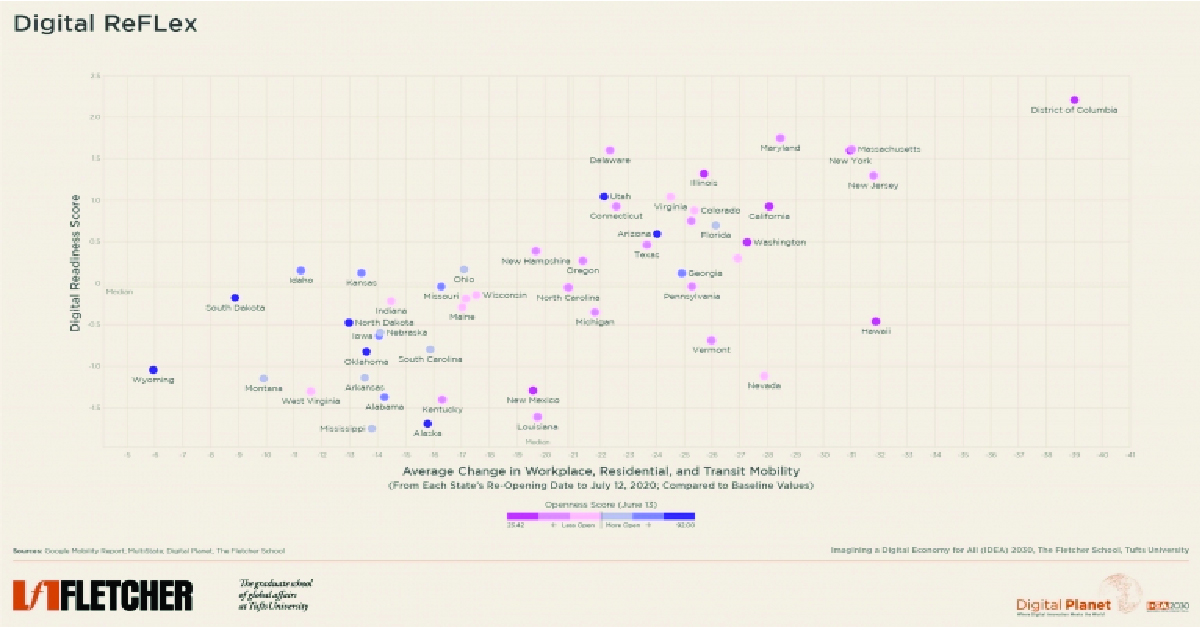
We scored and arrayed all 50 states and the District of Columbia on their digital readiness, average change in workplace, residential, and transit mobility (compared to baseline values), and average effective reproduction rate of the virus (Rt) from their unique re-opening date through July 12, 2020. Additionally, we incorporated MultiState’s Openness Scores as a proxy for quantifying a state’s degree of openness—i.e., how open is each state for business—as they navigate their way out in varied approaches.
A look at the scatter plot above shows a strong positive correlation between digital readiness and change in workplace, residential, and transit mobility; states possessing a greater capacity to work from home have continued to adopt stricter social distancing—perhaps because they could afford to do so (though this is notably reduced from our first analysis between March-May). As a state’s digital readiness and the capacity to endure longer periods of stay-at-home orders declines, the pressure to re-open mounts in order to alleviate adverse economic impacts.
States in the bottom-left quadrant then, maintain very high openness scores—potentially resulting from a lack of adequate digital infrastructure in place to ensure remote work, amongst other factors. Alaska, Montana, Oklahoma, and Wyoming, for example, opened up very quickly at the end of April; long before it was epidemiologically advisable.

Unsurprisingly, since re-opening, these states have become hotspots with effective reproduction rates far above 1 (Alaska: 1.20; Montana: 1.30; Oklahoma: 1.14; and Wyoming: 1.14) and also fall in the top 10 highest in the country. Those in the ‘danger zone’—with low digital readiness, low mobility, and high Rt—such as, Alabama, Arkansas, Kentucky, and West Virginia, to name a few, should be wary of re-opening too fast and climbing infection rates. On the other hand, states with low openness scores that have continued to observe strict social distancing measures and gradually re-opened in stages (Massachusetts, New Jersey, New York, and Maryland) are in a much better position to keep transmission rates low. A study by McKinsey, a consultancy, showed that changes in mobility patterns effectively predict reproduction rates 7-14 days into the future.
Nevertheless, mobility is just one cog in the COVID-reduction wheel. States in the bottom-right quadrant such as California, Florida, Nevada, and Hawaii, demonstrate that a variety of other factors—mask mandates, nature of work, employment industry, population density, outdoor recreation, packed bars, and people’s adherence to public health guidance, for instance—all matter in arresting the pandemic’s spread.

Finally, plotting the Digital and COVID Reflexes against each other shows a positive correlation, but interestingly a second trendline encompassing Montana, Hawaii, Idaho, Oregon, Florida, Texas, Arizona, California, and Utah, appears to the left. These states have notably pulled away and exhibited higher rates of infection since re-opening, causing some (California, Texas, and Florida) to reverse course.
As states stop and start their economies in reaction to the rising infection rates and case levels, this analysis highlights that higher digital readiness contributes to stricter social distancing measures. Coupled with lower openness and a controlled easing of restrictions, states that take things slow and steady have maintained lower infection rates, while hasty and early re-openings are a recipe for worsening spread. The United States continues to grapple with COVID-19; pushing for an open economy on the one hand, and public health measures seen as an obstacle to overcome on the other. Instead, states should consider effective virus containment as a conduit for swift economic recovery; not as an opposing force but a beneficial one.
Research Methodology
Digital Readiness Score
While only part of any economy’s work can be done remotely, Digital Planet examined the 50 states’ “digital reflex” by compiling a Digital Readiness Score for each state plus the District of Columbia. The Digital Readiness Scores are constructed using two indices:
- Work from Home Readiness; and
- Inclusive Internet and Digital Public Services.
Work from Home Readiness
In a post-pandemic world, remote working could become the new norm for many people. Realizing that not everyone can work from home, the Work from Home Readiness Index was developed using a range of indicators to assess the extent to which each state’s selected labor force could work from home. Some key measures include the state’s proportion of essential workers, access to technology devices at home, estimated share of the labor force that can work remotely, percent of the population that holds a bachelor’s degree or higher, unemployment claims between March 1-May 14, 2020, and the size of the information and services industry. Please refer to the datasheet for a full breakdown of indicator inputs, sources, and weights.
Inclusive Internet and Digital Public Services
While the capacity to work from home is more important than ever, citizens must also be able to access these services reliably, with affordable, and inclusive internet. Broadband coverage, quality, and equity are important prerequisites for remote work. We captured inclusive and affordable internet using BroadbandNow’s research studies and census data from the American Community Survey. Additionally, our inclusive digital public services measure examines how states utilize technology to serve their communities during COVID-19, and factors in qualitative indicators such as the quality of COVID-19 data reporting between March and May, technology development as a priority to state officials, and municipal broadband roadblocks and restrictions. Please refer to the datasheet for a full breakdown of indicator inputs, sources, and weights.
With an unprecedented global pandemic prompting a marked reliance on digital services while workplaces, schools, and government offices remain closed, states who score higher on this axis are presumed to be better equipped to move to online channels during the crisis.
Rt since Re-Opening
The average Rt for the 50 states plus District of Columbia was calculated from each state’s unique re-opening date (according to The Washington Post) through July 12, 2020, using Rt numbers by rt.live, where Rt represents the effective reproduction rate of the virus calculated for each locale. It is an estimate of how many secondary infections are likely to occur from a single infection in a specific area. Rt.live updates its methodology and model regularly, our numbers may differ slightly from the most recent version of the model.
Change in Workplace, Residential, and Transit Mobility since Re-Opening
The average change in workplace, residential, and transit mobility was calculated using Google COVID-19 Community Mobility Reports, which serves as a proxy for the extent to which citizens in the 50 states plus District of Columbia practice social distancing. We compiled each state’s average workplace, residential, and transit mobility change (compared to baseline values) between their unique re-opening date (according to The Washington Post) through July 12, 2020, and weighted each measure: 0.4 for residential and workplace, and 0.2 for transit. We inversed the residential change (to account for its positive sign as more people were staying at home) and combined the three values.
A more significant decrease in the change in workplace, residential, and transit mobility shows higher compliance with stay-at-home orders (for most states which issued them) and/or a higher level of voluntary compliance by citizens.
Openness Score
The average openness score was calculated from May 4-July 12, 2020, using MultiState’s COVID-19 State Reopening Guide, which serves as a proxy for quantifying a state’s degree of openness (i.e. how open is each state for business?).
The openness scores range from “most open,” indicating the state is fully open beyond standard social distancing guidelines (the highest possible score is 100) to “least open,” indicating the state is in full lockdown to (a score of 0).
All data and sources are available here.
Former Digital Planet Graduate Analysts Malavika Krishnan, Madhuri Mukherjee, and Devyani Singh worked on this analysis under the guidance of Bhaskar Chakravorti, Ravi Shankar Chaturvedi, Christina Filipovic, and Joy Zhang at Digital Planet, The Fletcher School, Tufts University.
This research is a part of the IDEA 2030 initiative, made possible by the generous support from the Mastercard Center for Inclusive Growth


