
Home > Off the Charts > Uneven State of the Union
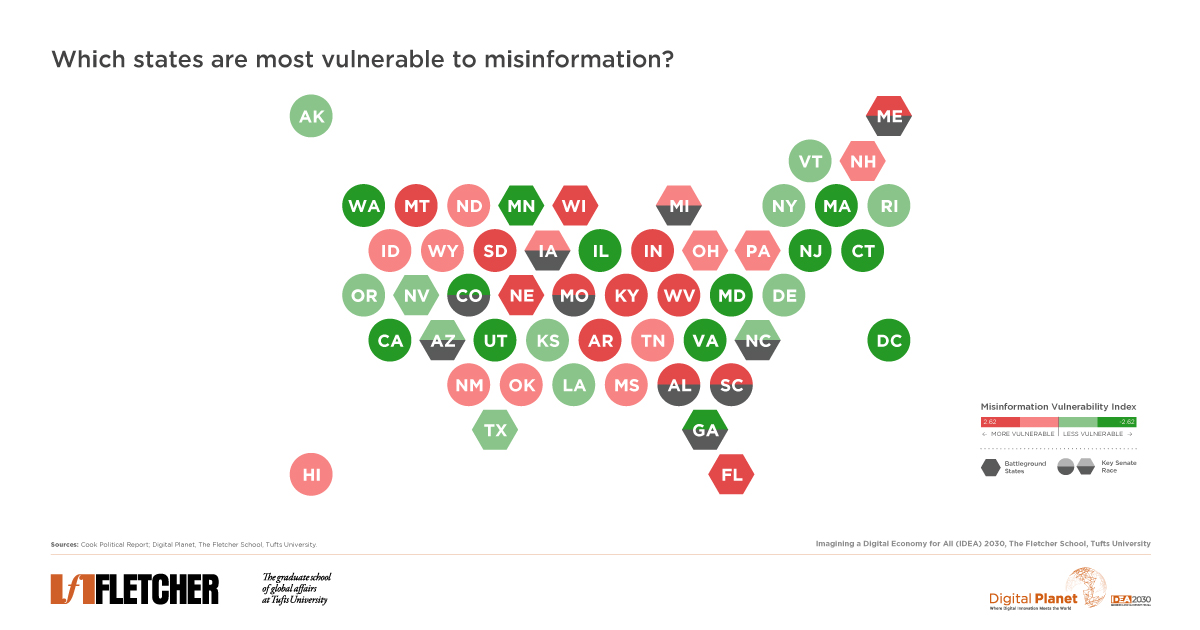
The Misinformation Maelstrom: A Mapping of Vulnerability Across America
The two major political parties in the United States are in an all-out sprint leading up to the presidential election. Neither has had a shortage of digital mediums to amplify their views to the public. The American public’s increased reliance on social media as a source of news is worrisome because of the propensity of these platforms to spread misinformation. The COVID-19 pandemic has only exacerbated this trend, tethering people ever more to their personal electronic devices and fostering a boom of both digital crime and misinformation.

(Note: Maine and Nebraska use the congressional district method of apportioning electoral votes and include two battleground districts (ME-2 and NE-2). The vulnerability to misinformation index measures vulnerability to both social media and traditional media.)
Key Observations and Insights
In this edition of Off the Charts, Digital Planet explores which states are most, and least, vulnerable to misinformation. We considered five evidence-based indicators: political polarization, education, age, traditional news viewership, trust in social media news. Our model uses the following definition, put forth by Princeton University Professor Andrew M. Guess and University of Utah Professor Benjamin A. Lyons, for misinformation: “a claim that contradicts or distorts common understandings of verifiable facts.” While other subsets of misinformation, such as disinformation, are not isolated variables in this model, they are included under the broader umbrella of misinformation in this analysis.
The visual above maps these findings with each state ranked from most vulnerable (dark red) to least vulnerable (dark green). Further, states are marked if they are (1) battleground (or swing) states and/or (2) key Senate races.
From a political lens, the most closely watched and highly competitive races are disproportionately in areas vulnerable to misinformation. Of the top 25 most vulnerable states, 12 are either in a battleground state or have a key Senate race approaching. In the 25 least vulnerable states and the District of Columbia, there are seven of such races ahead.
Misinformation Indicator Analysis
(indicators noted in underlined bold)
Our team reviewed survey data on how individuals across each state consumed information and identified five indicators. We weighted them according to their significance to produce an overall vulnerability index.
We looked at political polarization and ideology through national survey data from Global Web Index (GWI) and The American National Election Studies (ANES) to arrive at the degree to which each state leaned, in the aggregate, towards either being conservative or liberal. In this sorting, states largely fell into one of three general categories: liberal, conservative, or neutral. Within the conservative category, 19 states classified in the sub-category as “highly conservative” marking more than a third of U.S. states as polarized to the right.
Whether a state is right- or left-leaning and its degree of polarization can help us understand misinformation vulnerability by state. While misinformation can reach people across the political spectrum, conservatives are more likely to share misinformation than liberals or moderates. Further, an age effect links higher age with a greater likelihood of spreading misinformation. A 2019 study in Science Advances shows that older Americans, over the age of 65, were more likely to share fake news on Facebook than younger generations. Within the misinformation index, conservative states outright have a higher vulnerability score, as well as states with a higher median age.
We isolated right- and left-leaning news viewership by state to observe traditional news consumption habits with Fox News as a proxy for right-leaning news and MSNBC for left-leaning news. Pew Research Center, a nonpartisan think tank, noted about 65 percent of Republicans and Republican-leaning Americans trust the Fox News network. Although Fox News has historically relayed more inaccurate information to viewers, MSNBC still has been shown to communicate inaccurate information, albeit to a lesser extent. One recent study found more COVID-19 cases among viewers of a Fox News host who downplayed the pandemic.
Non-traditional sources of news, namely news from social media, have been gaining popularity due to ease of access during the COVID-19 pandemic. Social media is often praised for its effortless ways of keeping everyone informed. However, this convenience becomes dangerous when posted information is false. Fake news travels faster than facts—with humans, not bots, responsible for most of the spread. Trust in news on social media can often be misplaced. The presence of online misinformation is not a new concept, but as COVID-19 cases increased, so did cases of misinformation regarding the pandemic. This correlation is alarming, as research shows that the amount of people obtaining news from social media is rising; in July 2019, 55 percent of U.S. adults said they did so “often” or “sometimes.”
An individual’s education level attained can further be linked to misinformation vulnerability. Those who have not obtained a high school degree have a significantly harder time ranking the credibility of online news. As the Stanford History Education Group puts it “Education moves slowly. Technology doesn’t.” Fortunately, the general education level in the United States has been increasing. Between 2009 and 2019, the percent of individuals who had obtained either a high school or college degree jumped from 83% to 90%.
Concluding Remarks
The unfortunate fact is, dissemination of misinformation can mean higher engagement and economic benefits for social media platforms that publish it. Many groups benefit from the spread of fake stories: political parties with agendas, social media platforms, and those committed to undermining faith in American democracy. Platforms like Facebook and Twitter have a considerable influence: 73 percent and 71 percent of users, respectively, get their news on these sites. These companies, along with others, issued a joint industry statement in March noting that together they would combat fraud and misinformation about the virus. Unfortunately, 90 percent of the misinformation remained visible and did not contain content warnings. Social media companies continue to be criticized for their—in the words of Kara Swisher—“slow roll” approach to combatting misinformation. There is a great deal of work that needs to be done to contain the spread of misinformation but relying on social media companies alone will not be adequate.
Given the high-stakes political races (both Senate and presidential) taking place in many of the most vulnerable states in the US, and the targeted nature of election-related misinformation, those committed to limiting the spread of misinformation would be wise to consider a localized approach, taking into account the unique vulnerabilities of their states and local communities.
Research Methodology and Data
Index compilation methodology for scores follows the guidelines laid out by the OECD in their gold-standard Handbook on Constructing Composite Indicators. Weights for the indicators, clusters, and component hierarchy were assigned according to expert input under a budget allocation process (BAP).
All data and sources are available here.
Digital Planet student analysts Patrick Béliard, Heidy Acevedo, Mariam Amini, Joseph Dunbar, and Henry Fernandez worked on this analysis under the guidance of Bhaskar Chakravorti, Ravi Shankar Chaturvedi, Christina Filipovic, and Joy Zhang at Digital Planet, The Fletcher School, Tufts University.
This research is a part of the IDEA 2030 initiative, made possible by the generous support from the Mastercard Center for Inclusive Growth


