

Home > Off the Charts > Uneven State of the Union
Resilient Support Systems
The impact of digital infrastructure on the pandemic-induced loss in employment
Summary
Having robust digital platforms are key for business and public services continuity during the COVID-19 pandemic. While Kentucky and Washington both witnessed over a third of their workforce file for unemployment between March and mid-May, the latter state is better equipped to: 1) allow its employed workforce to work from home with low disruption; 2) enable unemployed workers to potentially shift to work that allows them to work from home; and most importantly, 3) support unemployed workers in their search for jobs and to seamlessly file for unemployment insurance online.

Key Observations and Insights
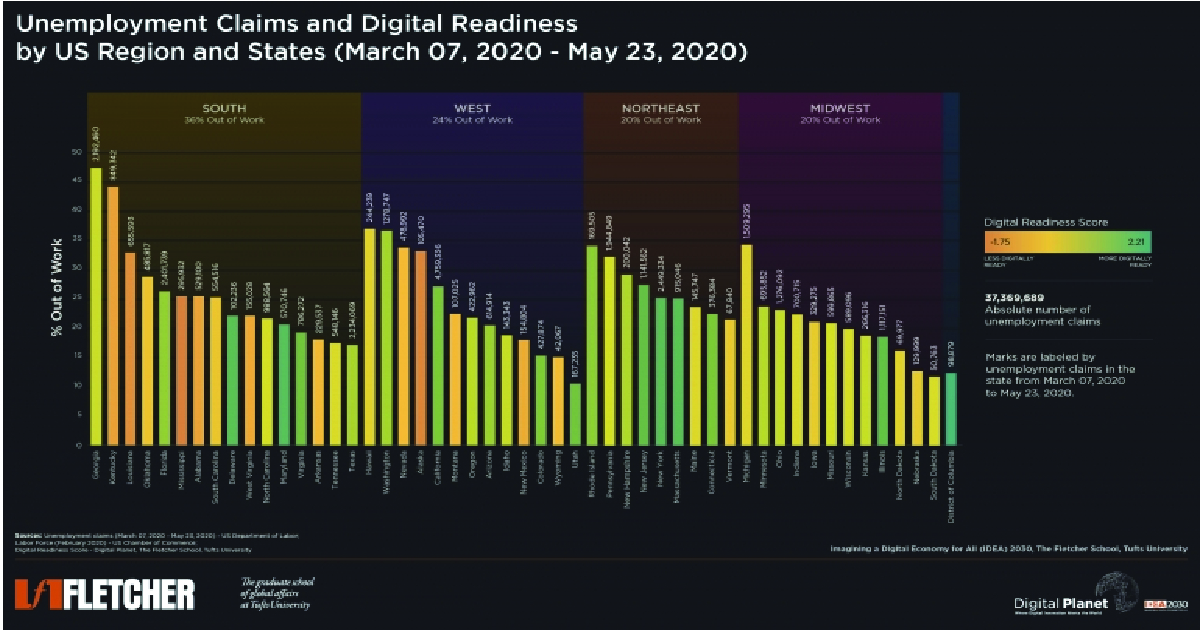
The U.S. Bureau of Labor Statistics’ official drop in unemployment rate to 13.3% in May does not completely account for the proportion of workforce that has been negatively impacted by the pandemic. Between March and the week ending May 23, 2020, 24.8% of the workforce in the United States (as it stood on February 2020) had filed for unemployment insurance. Even with reports of 4 million workers returning to work in May as stay-at-home orders began to ease, the estimate of the share of the workforce whose employment has been adversely impacted since March is still approximately 22%.
Regionally, the South accounted for over a third (36%) of unemployment claims filed between the weeks ending March 7 and May 23, followed by the West (24%), Northeast (20%), and Midwest (20%) – which is proportional to the share of workforce in these regions as of February 2020.
Georgia and Kentucky were the most negatively affected with over 40% of the workforce in each state filing for unemployment, followed closely by Hawaii and Washington, both of which saw over 35% of their respective workforces file unemployment claims during this period.
The state of digital readiness – i.e., having robust digital platforms that are key for business and public services continuity, including digital payments options, and a resilient internet infrastructure that can withstand traffic surges – is a contributing factor to the varying impact on states of the pandemic-induced loss of employment.
Compared to Kentucky, Washington is better equipped to: 1) allow its employed workforce to work from home with low disruption; 2) enable unemployed workers to potentially shift to work that allows them to work from home; and most importantly, 3) support unemployed workers in their search for jobs and to seamlessly file for unemployment benefits online. Utah, which enjoys a high state of digital readiness and among the lowest unemployment claims is also leading the way in creating online upskilling for displaced workers – SkillUpUtah.com is an outcome of collaboration between public, private, and the third sectors.
According to the Economic Policy Institute, for every 10 people who successfully filed for unemployment benefits in April 2020, three to four more tried but were unable to, implying that states ranking higher on the digital readiness scale also have better and more complete unemployment claims data, while states like Kentucky, Louisiana, Mississippi, Alabama, and Nevada (along with 22 others) that do not fare well on the digital readiness scale are likely to underestimate and under-report their unemployment numbers.
States with lower levels of digital readiness may see a relatively prolonged period of high unemployment relative to those with better digital infrastructure and access, since many jobless workers may need to wait out the virus and stay-at-home orders before they are able to re-start their job search. The official unemployment rate of 13.3% (despite being down from 14.7% in April) continues to exclude the proportion of population currently out of work or under-employed due to the pandemic and has been unable to look for work (a phenomenon that the Bureau of Labor Statistics is attempting capture by including these five additional questions as part of its population survey).
Of the 10 states that had more than 30% of their workforce file for unemployment between March and mid-May, only two (Washington and Rhode Island) score well in our measure of digital readiness. Georgia ranked moderately (close to the median) and the remaining seven states (Kentucky, Hawaii, Michigan, Nevada, Alaska, Louisiana, and Pennsylvania) had below average digital readiness measures.
The Northeast is currently the most digitally ready region in the United States, followed in descending order by the West, Midwest, and South. Investing in digital infrastructure and particularly equal access is crucial, especially as states begin to ease lockdowns to allow for more nimble decision-making around in-person office work.
Research Methodology
Unemployment Claims
The cumulative number of unemployment claims by state is pulled from the weekly report issued by the U.S. Department of Labor, and spans the weeks ending Mar 7, 2020 to May 23, 2020 (state data lags national data by one week).
Total unemployment claims filed in each state between March and mid-May is the number above each bar on the visual.
Out of Work
Out of Work measures the proportion of a state’s total labor force (as of February 2020) that has filed for unemployment claims within the weeks ending Mar 7, 2020 to May 23, 2020. The cumulative number of unemployment claims for each state during this period is taken from the U.S. Department of Labor and divided by the state’s total labor force (in February 2020) from the U.S. Chamber of Commerce.
A greater out of work percentage reflects a higher proportion of workers in the state impacted by work closures and social distancing measures brought on by COVID-19.
Digital Readiness Score
While only part of any economy’s work can be done remotely, Digital Planet examined the 50 states’ “digital reflex” by compiling a Digital Readiness Score for each state plus the District of Columbia. The Digital Readiness Scores are constructed using two indices: Work from Home Readiness; and Inclusive Internet and Digital Public Services.
Work from Home Readiness
In a post-pandemic world, remote working could become the new norm for many people. Realizing that not everyone can work from home, the Work from Home Readiness Index was developed using a range of indicators to assess the extent to which each state’s selected labor force could work from home. Some key measures include the state’s proportion of essential workers, access to technology devices at home, estimated share of the labor force that can work remotely, percent of the population that holds a bachelor’s degree or higher, unemployment claims since March 1, 2020, and the size of the information and services industry. Please refer to the data sheet for a full breakdown of indicator inputs, sources, and weights.
Inclusive Internet and Digital Public Services
While the capacity to work from home is more important than ever, citizens must also be able to access these services reliably, with affordable, and inclusive internet. Broadband coverage, quality, and, equity, are important prerequisites for remote work. We captured inclusive and affordable internet using BroadbandNow’s research studies and census data from the American Community Survey. Additionally, inclusive digital public services examines how states utilize technology to serve their communities during COVID-19, and factors in qualitative indicators such as the quality of COVID-19 data reporting between March and May, technology development as a priority to state officials, and municipal broadband roadblocks and restrictions. Please refer to the data sheet for a full breakdown of indicator inputs, sources, and weights.
With an unprecedented global pandemic prompting a marked reliance on digital services while workplaces, schools, and government offices remain closed, states who score higher on this measure are presumed to be better equipped to move to online channels during the crisis.
Digital Readiness is reflected by the color scale in the visual.
All data and sources are available here.
Former Digital Planet Graduate Analysts Malavika Krishnan, Madhuri Mukherjee, and Devyani Singh worked on this analysis under the guidance of Bhaskar Chakravorti, Ravi Shankar Chaturvedi, Christina Filipovic, and Joy Zhang at Digital Planet, The Fletcher School, Tufts University.


