COVID, jobs and prices in the U.S. food system: How much has changed?
By Leah Costlow & Will Masters
More than 7 months into the pandemic, America remains in upheaval. Massive job losses, disease risks and other disruptions continue to affect almost every American household. What’s happened to jobs and prices in the food system?
Back in January 2019, this blog had a post on employment trends in agriculture and food in the US. We were recently prompted by Niamh Kelly at Glopan to revisit those data, to provide an update on jobs and prices in the pandemic, beyond the April 2020 Friedman seminar on COVID in the food system. Plenty of others have written in more detail on how COVID is affecting the food system, for example among agricultural economics in this special issue of the AEPP journal, or the wonderful journalists at FERN, The Counter and so many other outlets. This post is intended to complement those more detailed analyses, putting COVID in the context of longer-term trends than are easy to overlook.
1. Food service jobs were the hardest hit, and have not recovered
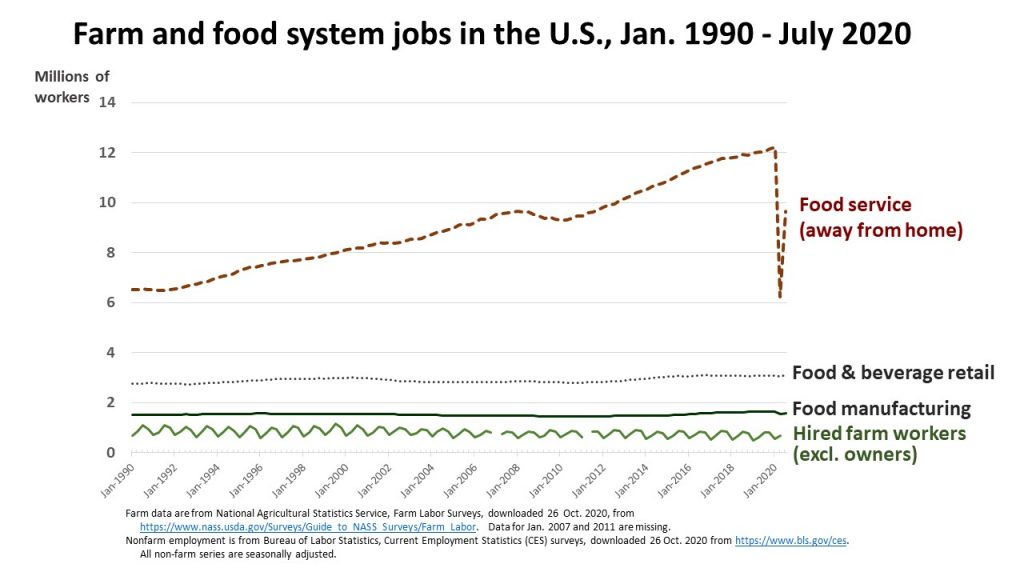
Before the pandemic, by far the fastest growth in new food jobs was in food and beverage service. The spread of COVID forced Americans to stay home, and half of all food service jobs were lost between January and April. Workers in food manufacturing stayed on the job but faced high levels of disease transmission, especially in crowded meatpacking plants.
About half of the lost food service jobs have since returned, but we still have about a decade’s worth of job growth left to recover. The chart below uses Current Employment Survey to compare the three main kinds of off-farm jobs in the food system, and compare them to jobs on farms:
2. Groceries are more expensive, but farmers are paid less
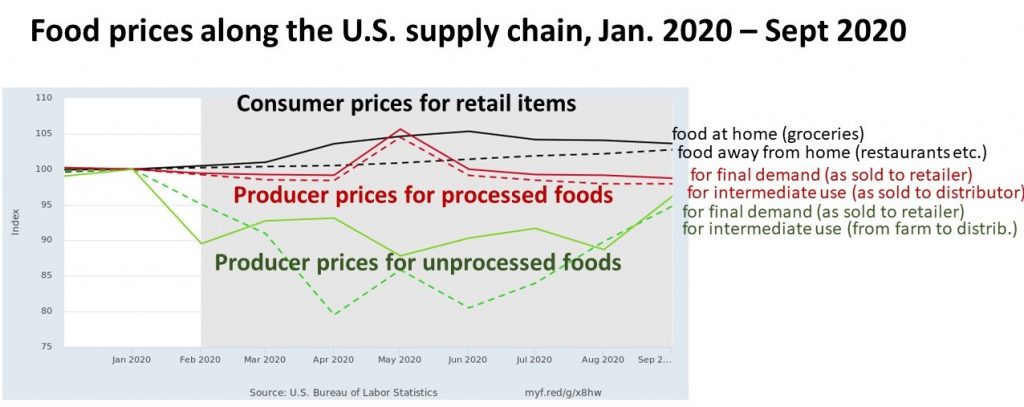
Beyond its direct impact through illness, isolation and job loss, the pandemic has had a huge impact on food prices. As discussed in our April seminar on COVID impacts, at first there were a few wild swings in retail and farm prices as supply chains switched over from restaurants to grocery stores. Now prices have stabilized, but not in a good way: Consumers are paying more for groceries, while farmers get less for their raw produce.
The chart below shows U.S. national average prices for food at each level of the supply chain, with each item weighted by its share of total expenditure, and each index set to 100 in January 2020. There was a brief spike in May for producers’ wholesale prices, shown in red, indicating a period of scarcity due to panic buying and stock buildups, but general the picture is simply a wider markups along the farm-to-consumer supply chain due to increased costs imposed by COVID.
3. Pandemic grocery spending is still sky-high
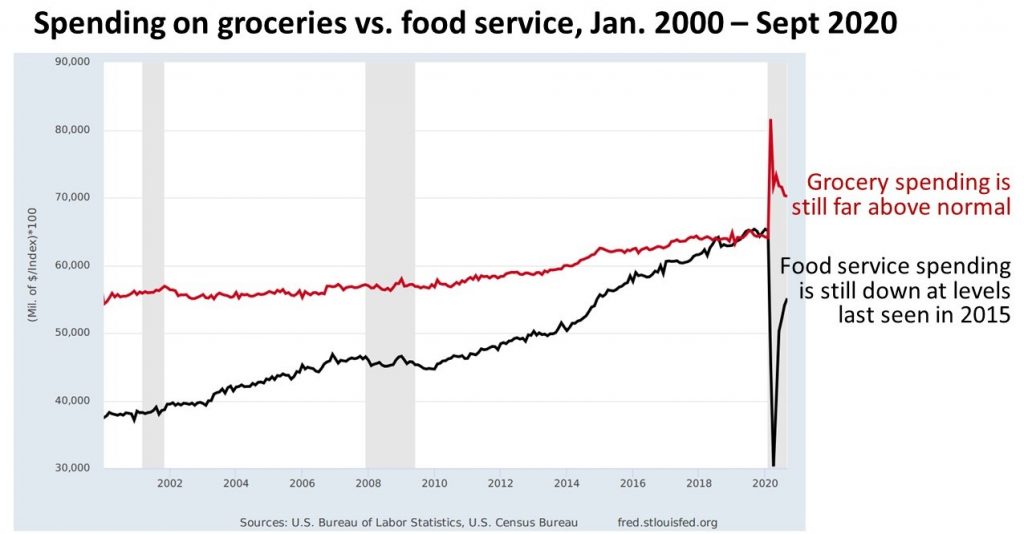
The wild swing in consumer spending from food service to groceries is shown in the chart below, revealing that only half of the initial COVID shock was recovered by mid-September. Further switch back to restaurants instead of grocery stores will be limited by continued spread of the disease, especially as cold weather forces more people indoors where transmission rates are higher.
4. Farm jobs remain rare for those who don’t own a farm
The USDA counts about 2 million farms in the U.S. About 98% of them are owner-operated family enterprises with few if any employees. Some are newly formed, helped by efforts like our New Entry Sustainable Farming Program, but most are run by family members who grew up farming. Until the 1990s, U.S. farm families were poorer than non-farm families, often much poorer, and most of them left farming in search of higher incomes in towns and cities. The number of farm families peaked at almost 7 million farms in 1935. Many exits from farming were voluntary, but in the 1930s and again in the 1980s many faced bankruptcy due to low prices or high interest rates, and about one million Black farmers who acquired land after the civil war were forced off by violence and other means.
By the 1990s, farm exits had slowed to a crawl, because remaining farmers were renting or had bought enough of their neighbors’ land for farm sizes to be big enough to employ one or two family members at the prevailing standard of living. At those farm sizes, thanks to high and rising productivity per acre using the latest seeds and other techniques, farm incomes reached and passed average incomes of other American in the 1990s. Rural poverty remained widespread but farm owners rarely have incomes below U.S. poverty lines, and thanks to high land values and other assets their wealth is now far above the U.S. average. Owning a farm now requires prodigious skills and considerable wealth, but not a lot of time: the last big survey of labor use on U.S. farms found that they took about 1.5 person-years to run (an average of 3,250 hrs/yr), with family members still doing most of the work, as shown in Table 4 of this report.
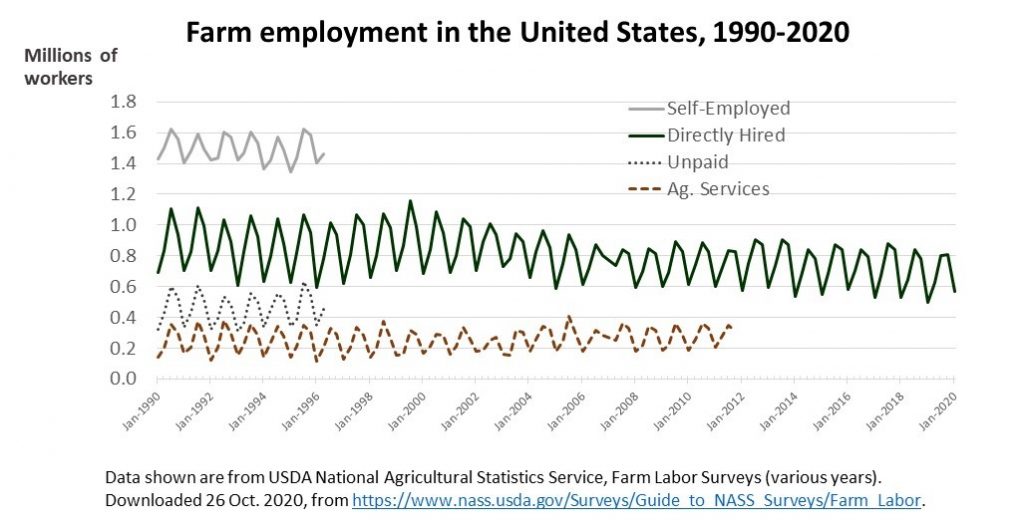
The few jobs in farming that do exist are often seasonal, and the number of hired farmworkers counted by the USDA in April 2020 was no different or even higher than expected for the time of year. Early lockdowns prevented some H2-A guestworkers from arriving in the U.S. on schedule, but in April the Department of Homeland Security issued a rule making it easier for farm owners to hire H2-A workers who were already in the country. Farmworker safety is the more serious problem, as poor housing conditions and shared transportation were implicated in several large COVID-19 outbreaks in the fresh fruit and vegetable industry this summer.
The chart below summarizes the overall employment data from successive waves of farm labor surveys in the 1990s and 2000s. The only category with continuous measurement is “directly hired” workers, which declined in the 2000s and has not increased since the 2008 recession.
5. Farms provide food, but off-farm work provides employment
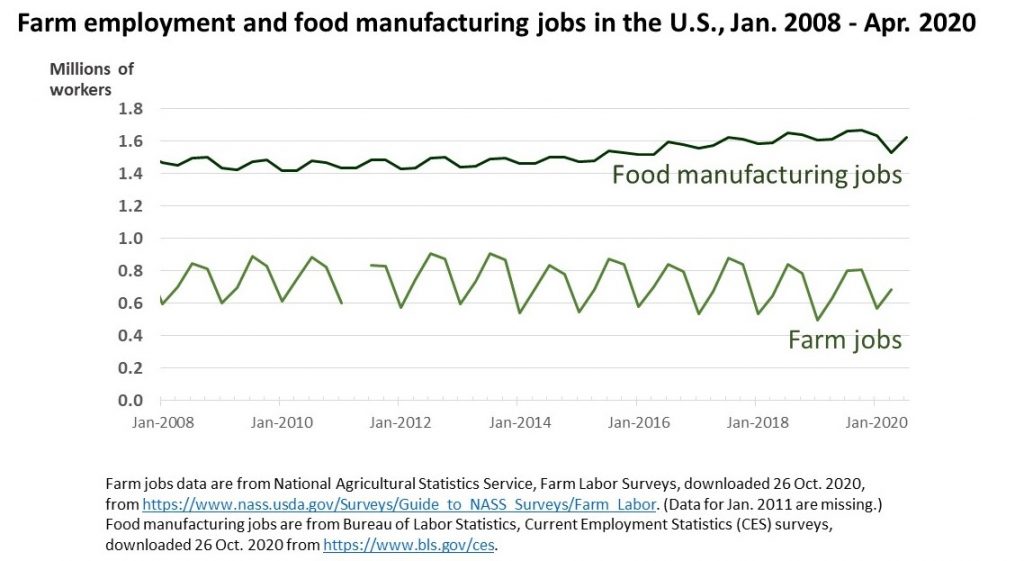
Farms are the source of food, but jobs in the food system start after harvest. Food manufacturing provides about twice as many jobs as farming, and grew significantly from its post-recession bottom of 1.4 million jobs in January 2010 to an all-time high of almost 1.7 million jobs in October 2019. Job levels dropped modestly in April 2020 and have mostly recovered since then. Losses were highest in bread and tortilla manufacturing, but were generally divided across multiple sectors of food manufacturing. Notably, workers stayed on the job despite massive health risks in meatpacking plants, which is the largest subsector of food manufacturing with over 500,000 jobs.
Data on non-farm jobs are collected by the Bureau of Labor Statistics, Current Employment Surveys. The chart below compares total employment on farms with the number of jobs classified as food manufacturing, from January 2008 through July 2020.
In conclusion…
The U.S. food system is a diverse patchwork, offering many different kinds of jobs. Those most hard-hit by COVID are those exposed to outbreaks in meatpacking and other unsafe workplaces, and people in the restaurant and food service industry whose customers stayed home to avoid illness. COVID has also imposed severe costs on everyone through wider marketing margins, with higher retail prices paid by consumers and lower bulk commodity prices received by producers.
In the U.S. as in other high-income countries, the number of jobs on farms is low and not growing. The number of jobs in food manufacturing is about twice that of farming, but that number is also not growing. Net job creation occurs primarily in service activities, partly in grocery retailing which now provides over 3 million jobs, about four times as many as farming, but mostly in food service which has added almost 3 million jobs over the past decade. All of that decade’s job growth and more was wiped out by COVID, putting service workers at the heart of efforts such as Boston City Councillor Michelle Wu’s food justice agenda. It’s election time in America, with everything at stake. The food system is central to all our lives and deserves our close attention.
