Hi everybody! It’s been a little bit since my last statistics post (just about one year, in fact), so it seemed high time for me to do another one of these. Today I’ll be focusing on October 2016 and March 2017, which were our two Affiliation Months this year. For those who are unfamiliar with the term, that’s when the library staff go and ask every person in the library what their program is, so that we can have a general sense of how our space is being used.
Still with me? Good!

Click to see full size
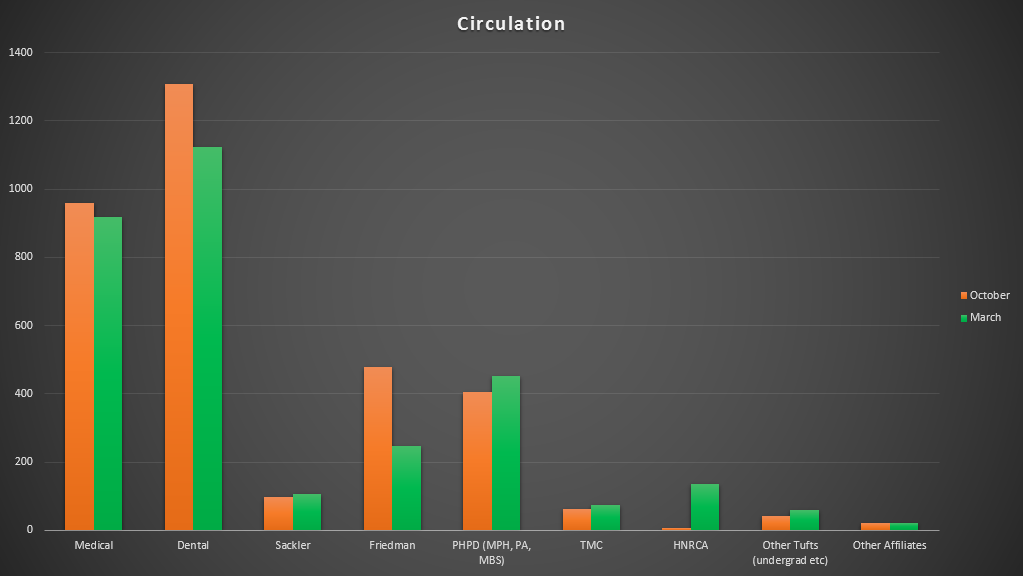
This first chart is comparing the Affiliation Stats from October 2016 and March 2017. To gather this info, we chose 7 days out of each month (one Sunday, one Monday, etc. All were chosen randomly) and on those days went around 4 times a day. This is always an interesting comparison due to the different programs and the way they operate. Dental and Medical students were gearing up for board and class exams, so it’s no surprise that we would see so many extras in March. There was a jump in PA as well (new class means new exams!), but then we saw drops with Sackler, Friedman, MBS, and PHPD. So what happened there? It’s hard to say. Different timing on exams, different demands on the classes, all sorts of things can affect attendance in the library. Ultimately, March was still the busier month: we counted 3,327 people in March, but only counted 3,115 people back in October.
The thing to keep in mind is that these numbers are only a snapshot. To truly know what the individual program attendance in this library is like for a full month we would need to gather this data every single day for that entire month, and that is unfortunately (or fortunately, depending on how much quiet you like) unrealistic for us. Do you know what is quite realistic, however? Collecting a month’s worth of circulation data!
Click to enlarge
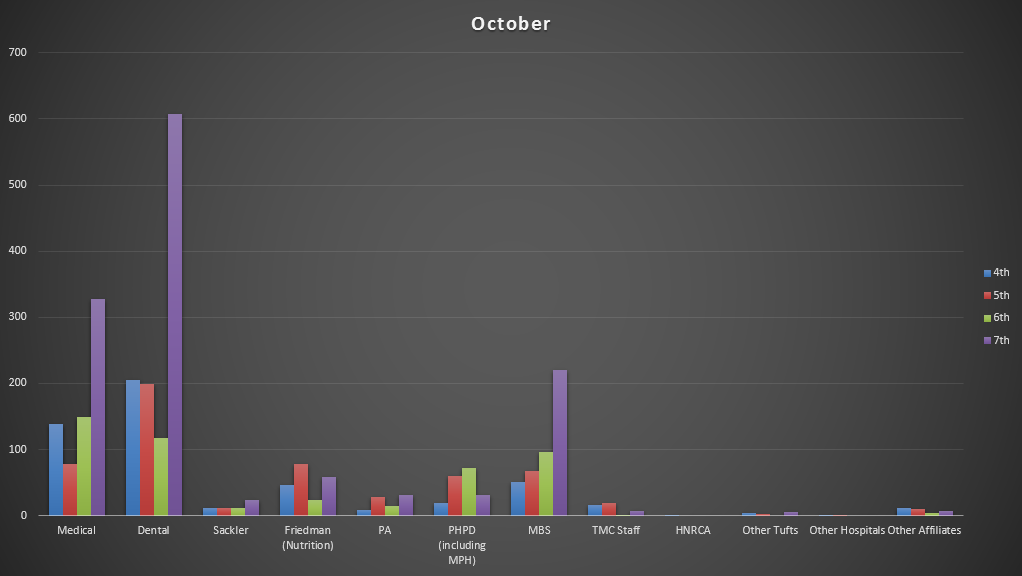
Bam. That’s a full month of data right there! So what does this show us when compared to the Affiliation graph? Well for one, we can see that the space was occupied more than our things were being checked out to a point, which is actually pretty normal. People do like checking things out (skulls! laptops! books! phone chargers! oh my!), but the library keeps adding more and more space, making it easier to go and hide out and get your studying in.
But here are some thoughts: why are the numbers so similar? We never have had a 1-1 relationship between studying and circulation before, but parts of this are surprisingly close. What’s causing the numbers to fluctuate the way they do? Consider: we have exams in March and April, and Extended Hours at the end of March. Affiliation was overall higher (by 212 people), but Circulation was lower (by 249 checkouts). Weird, right?
There are many factors that affect all of these numbers, but I won’t be going into them in this post. There’s only so much space, and I still need to talk about the floors!
Click to embiggen
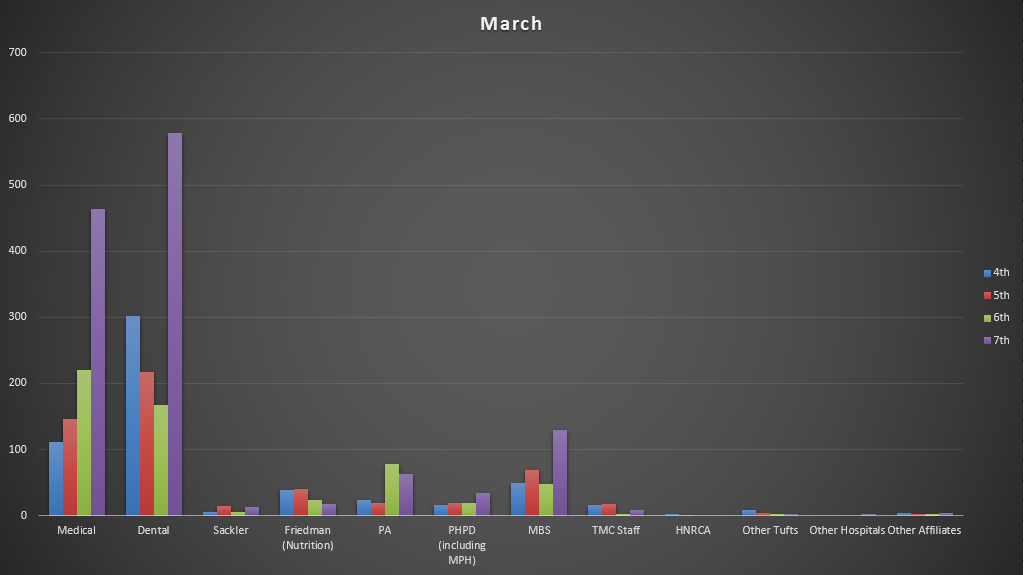
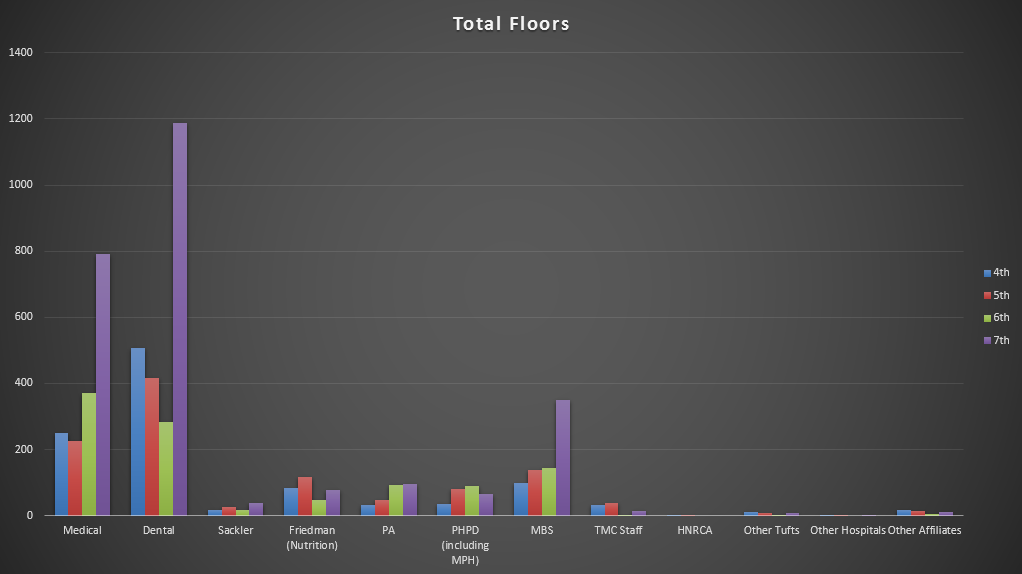
So. Dental students love the 7th floor. Surprise! Medical and MBS are also huge fans, so it looks like all of those new study carrels we added last summer really helped! Everybody else is spread rather evenly over the floors, although I do find it interesting that the PA students go up to 7 when they’re not in class (I guess to get away from the classrooms – can’t say I blame anyone). It’s good to see people like the furniture and spaces so much! Warms the heart (which is numbered and on a stand, and you can check out from the Library Service desk for 4 hours at a time. I’m not kidding).
The 7th floor has always been the most popular (generally about twice as popular as any of the other floors), and the breakdown after that is always fascinating. Medical students overwhelmingly prefer the 7th, followed by 6 – study quiet, which makes sense. Since the 4th and 5th floors offer some small group opportunities, those are split evenly. Dental may trend toward groups even more so than I used to think – perhaps that’s why there are so many up on 7, and then in decreasing order from 4, 5, and 6?
I would like to state that it is exciting to see Sackler, Friedman, PA, PHPD, and MBS showing up in larger and larger numbers. Hirsh Health Sciences Library is for everyone on the campus, and we want you all to feel welcome! That’s why we have so many study carrels, and the Collaboration Rooms, and craft days, and all the other things that make the days go round. And based on the posts from over the last few years, it seems like we’re only getting more and more popular, which is fantastic. Feel free to keep coming in bigger numbers, we have space for you all!
And on that uplifting note I will leave you for now. Perhaps I will be able to do a look at the full year’s numbers in a few months, so keep your eyes peeled. Until then: good luck with any exams you have left, and I’ll see you all around the library!
Tom
Share this post!


Follow Us!


