Hi all,
It’s been a little bit since my last post on Hirsh Library Statistics, which means it’s time again! So pour your favorite caffeinated beverage, grab a plate of free food (statistically speaking, there’s free food somewhere in this building right now), and relax as I offer you some numbers and information that you will not be tested on.
What a relief, right?
So, first up: we’ve actually held relatively steady this year as compared to last year, in terms of circulation and head counts. This probably comes as a surprise to everyone who has only been busier every year (I know I have), but there are always environmental factors to account for. For instance, if everyone’s using ebooks, they don’t need to check things out of Reserve, and in the numbers it looks like we’ve gone down. But our Open Workshops, librarian consultations, and even on the fly assistance at the Service Desk have all been super busy. So I want you to keep that in mind as you read on: everything requires a grain of salt.
Also to keep in mind, these numbers will be from July 1, 2017 to May 31, 2018. The most interesting ones are smack in the center of the school year, though. For instance: our single busiest circulation day of the year was October 4th, when we were averaging a checkout every 5 minutes. That’s nutty! And that doesn’t account for all of the research assistance, troubleshooting, or item returns.
Of the top 10 spots for busiest Circulation day of the year, 4 are in October (which accounts for the top 3 spots), 3 are in September, and then the remainder is split between November, February, and March (there was a tie for #10).
Yes, that’s right. February. February! Here, let me shock you: This year, the busiest month was October, at 3412 checkouts. Second place went to September at 2983, but the shocker is February as third place and 28868. Third! I’m glad that you all love our library so much more than the cold February weather, because dang.
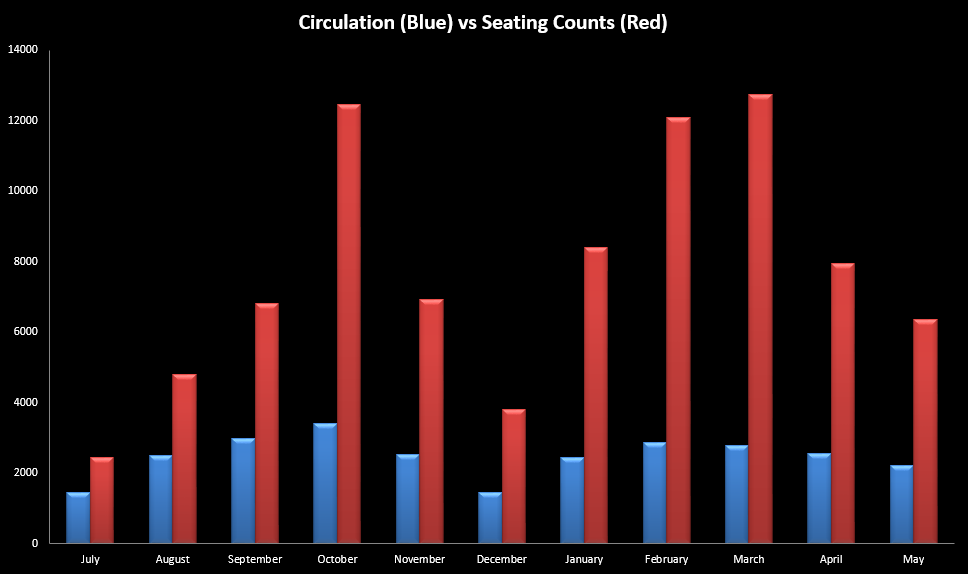
Click to embiggen
Okay, so that’s the overall look of things. The blue bars are the total numbers of times we’ve checked things out, and the red bars are the total numbers of people we’ve counted in the library. Things to know: the blue bars do not count the number of people, just number of checkouts (we don’t have a way to count number of people who have checked things out). And the red bars require staff to physically walk around, so there’s an element of human error in there. But still, what a snapshot!
You may also notice that October, while still very full, was actually not the top spot in seating counts. That honor goes to March, and my best guess would be “exam season.” But October cinched its second place spot, followed (again!) by February in third. Each one of those months is over 12,000 people sitting in the library, by the way. And in case you’re wondering, October did have the single busiest day for those, at 2,590 people on the 29th. February comes in second place here, with 1,057.
Dang, what a month.
Okay, so I know what you’re thinking. “Tom, what about all those times we were asked what program we were with? What’s the deal with that?” Well good news, I have the deal with that!
For those who might not remember: HHSL staff walked around a few times a day, 7 days in the month of October and again in March, in an effort to find out how much the various programs use our library space, and we got some neat data. Behold!
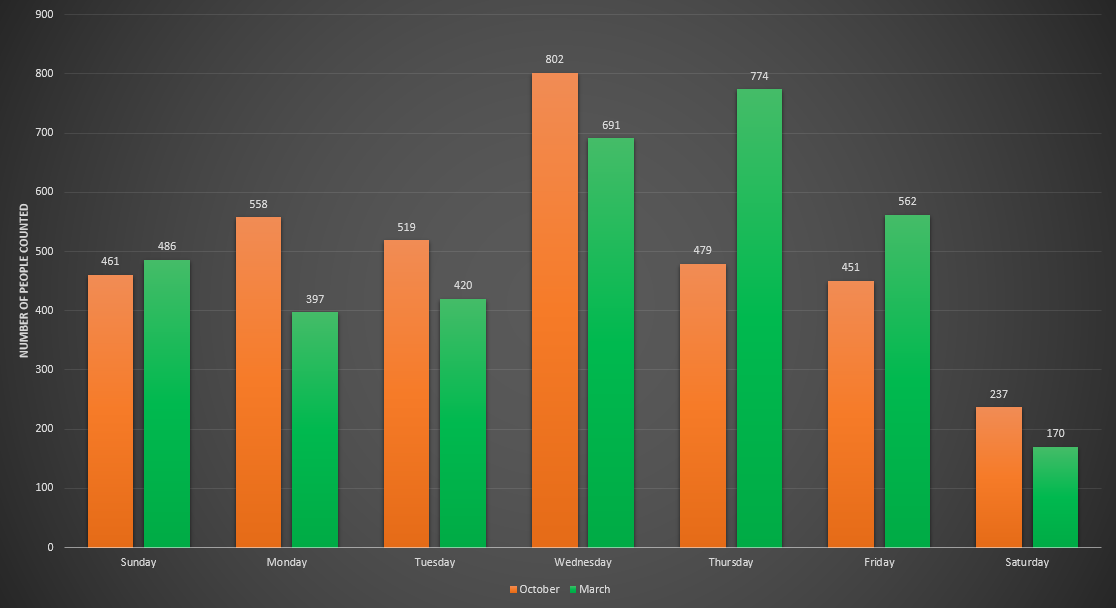
Click to enlarge
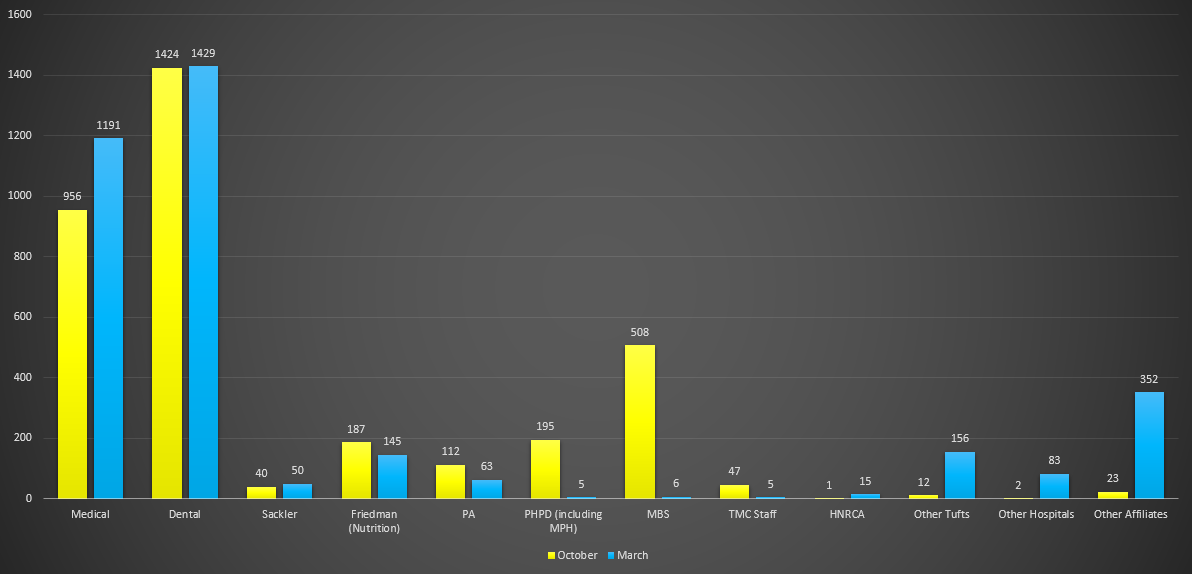
Click to make big
That’s a whole lot of people. That top chart focuses on the day of the week of a given count, and the bottom compares each program. I find that shift from being busier earlier in the week to being busier in the latter half rather interesting, although I don’t know if I can find a particular reason for it. Timing of exams, perhaps?
The second chart has my attention, however. Look at some of those numbers! I wonder what happened with the PHPD and MBS numbers, though. I do know that their exams did not quite line up with our counts the way that Dental and Medical’s did, so if I had to guess I’d say that it was just an issue of two or three weeks. Crazy how much of a difference that makes!
Finally, I will leave you with this chart, which goes to show just how much people love the 7th floor. Fun fact about this one: when you look at the numbers, the 7th floor is consistently twice as populated as any other floor. No wonder some people have trouble finding study cubicles – they’re always full!
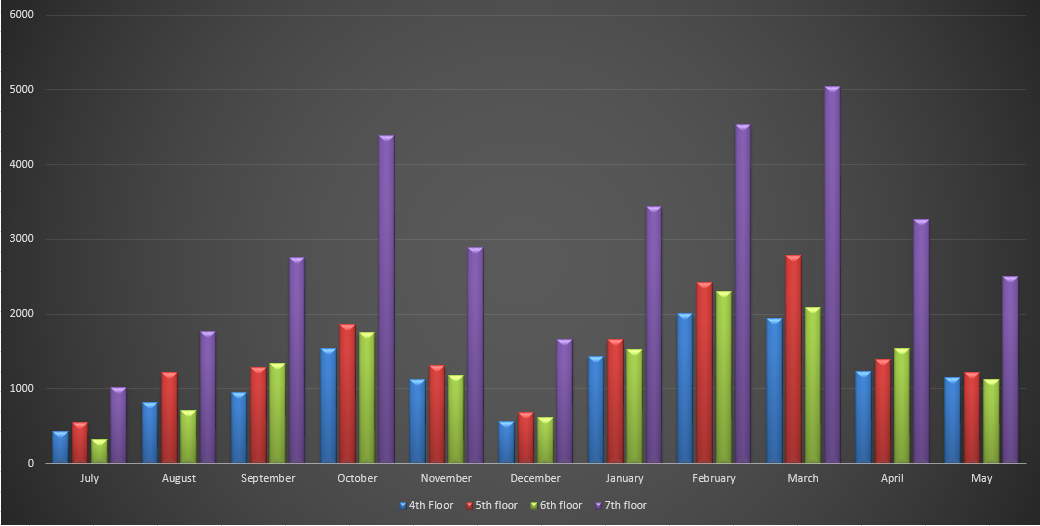
Click to get all up in it
If you want to get a little deeper into this all, or have any questions about it, I am at the the HHSL Service Desk five days a week, and am always happy to talk shop. Otherwise, I hope you’re all enjoying the weather, and I look forward to seeing what the next year brings us!
Tom
Share this post!


Follow Us!


