
Hi everyone! Happy December. But we are here to talk about October, so…Happy October in Retrospect.
As you may recall, back in October we walked around and asked you all what school you were with. Well, this is the result!
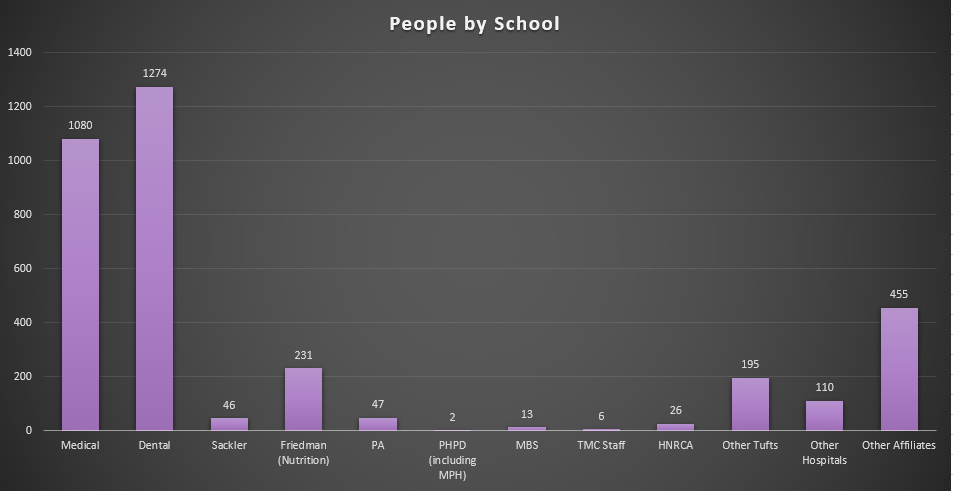
Click to enlarge
We counted a lot of people! I for one am glad you all like us here. A few people have asked me if there were any surprises with this data, but honestly, not really. The Dental school coming in at 1274, Medical coming in at 1080, and Friedman coming in third with 231 is all the sort of thing I am used to seeing in these numbers. Which is not to say it’s bad! It’s actually quite nice to see how consistent we’ve been over the years, especially as we keep adding more and more seating (and subsequently see these numbers grow even larger from time to time).
Now for the unaware, we tend to time this survey so that we get a full week’s worth of data, even if they days themselves are spread out over the course of a month (randomized, with certain accounting for things like Indigenous Peoples’ Day). This is what that “week” ended up looking like this time:
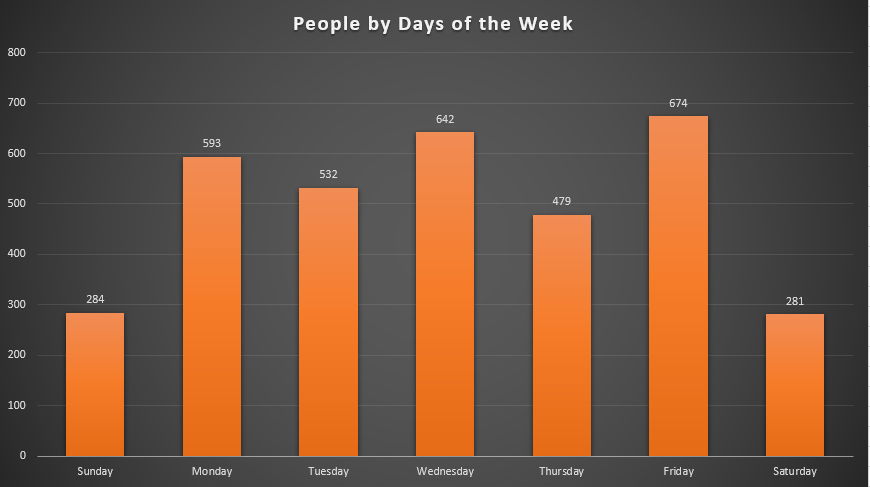
Click to enlarge
I found this data to be the surprising data. Friday was our busiest day! We counted 674 people on the Friday we did this, and that is astonishing to me. Wednesday being 642 makes sense, and traditionally the busiest day of the week for us tends to alternate between Tuesday, Wednesday, and Thursday, and Saturday being the slowest at 281 sounds right to me. Heck, even Sunday only being 284 seems right. But Friday being the busiest day for counting? I am truly surprised by that.
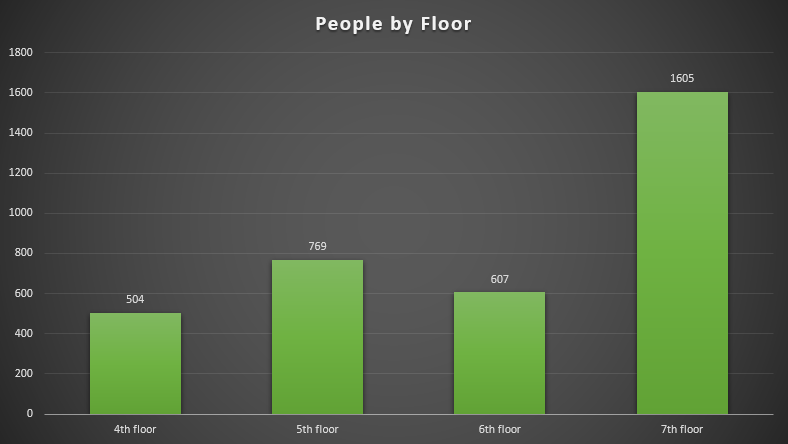
Naturally, because I am me, I also broke this data up by time of the day and by floor, like so:

Click to enlarge
Click to enlarge
Remember earlier, when I was talking about the school/program breakdown being what I expected? Well, the times and floors are pretty typical of what I see month-to-month with our other data, but this is a great way to take a look at a day in the life of the library. We get crazy busy right around lunch, stay that way through the afternoon, there’s a slight tapering off around dinner, and then then the number of people in the library drops by the final count of the night (in this case, from 959 people at 6pm down to 328 at 3pm).
That graph of the floor count is frankly one of my favorite pieces of data in the library. We have been adding so many chairs and so much more furniture over the years the the amount of people on the 7th floor just keeps going up, and as of this past October we were counting over double the amount of people on that floor as any other! Just look at that: the 7th floor had 1605 people counted on it, and the 5th floor came in second at a distance (less than half!) 769 people. That’s nuts. I’m sure it doesn’t surprise anybody who’s been up there, of course, but it’s still nuts.
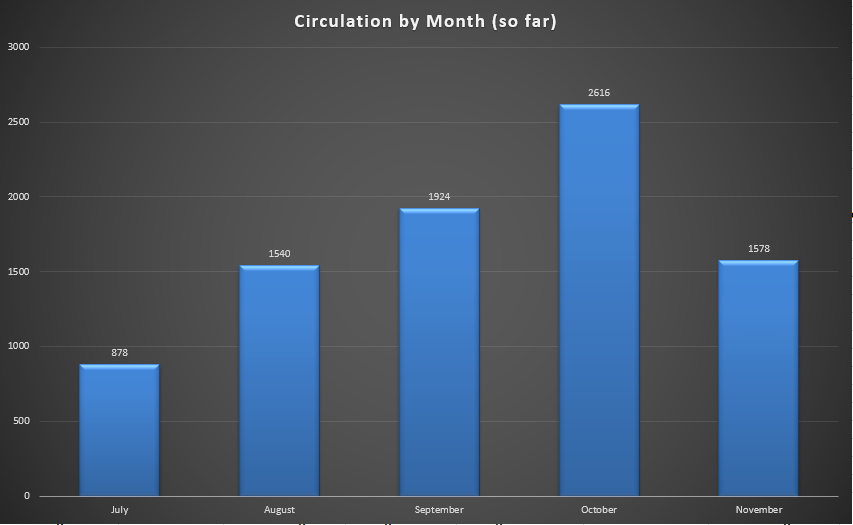
Click to enlarge
Finally, to bring it all home and give you a spot of context, this graph is the Circulation data from July – November, which as of writing is the most recent data I have. To be clear, it is the number of checkouts per month, not the number of people who have checked things out (because if you check out a skull, a laptop, and a book, that could just be 1 person, but 3 checkouts. See how it works?). October is far and away the most checkouts, at 2616 – September is a relatively distant second at 1924. Given the change in some curricula on campus, I don’t know what to expect for the spring this year – generally, October and April are our busiest months, but time will tell! Hopefully I’ll have some interesting stories from the data come my next summer retrospective.
Well, thank you for reading! I hope this fall brought good things for you, and I hope the winter (and subsequent spring) bring even better! Have a great day everyone, and if you come by the desk on the 4th floor make sure to say hi! I’ll probably be there.
-Tom-
Share this post!


Follow Us!


