
Home > Off the Charts > Urban-Rural Divides: The Uneven Experience of COVID-19 Across the States
Urban-Rural Divides: The Uneven Experience of COVID-19 Across the States
In the first phase of our research, we examined how states differed in their responses to and containment of COVID-19. This was followed by an in-depth analysis of which states were (not) digitally ready to work from home. We now investigate which states across the rural-urban continuum were able to digitally work from home, while containing the spread of the pandemic.
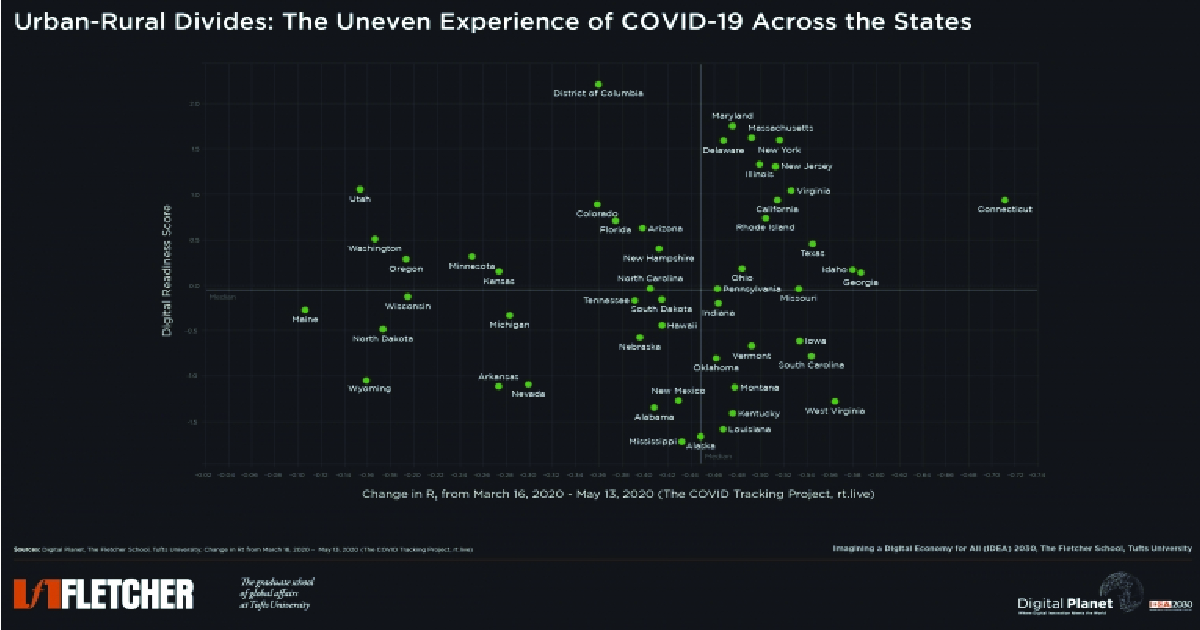
We scored and arrayed all 50 states and the District of Columbia on their digital readiness and average change in effective reproduction rate of the virus (Rt) from March 16 to May 13, 2020. Additionally, we incorporated state-level data on populations living in rural areas to understand the varying impacts and experiences of COVID-19 across the urban-rural divide.


The scatter plot shows an unsurprising cluster in the top-right quadrant; states with high digital readiness scores also did well in reducing infection rates. These states benefited, relatively speaking, from better work from home capabilities, inclusive internet access, digital public services, and a significant number of jobs in the low-touch information economy – all of which contributed to an easier transition to ‘remote’ working and greater social distancing.
Key Observations & Insights
States with Digital Readiness Scores below the median also tend to have a high proportion of their populations residing in rural areas. These states’ success in reducing infection rates fall across the spectrum––from North Dakota and Wyoming showing little reduction in infections to South Carolina and West Virginia on the other end faring better during the period of this analysis.
Among states with a higher share of rural population, the nature of employment – i.e., manual and high touch as agriculture and manufacturing tend to be – and the digitizability of key activities of said professions have a bearing on whether infections can be contained.
Rural Tennessee and Arkansas were lax in implementing social distancing measures and consequently had little success in reducing infection rates. Nor could they afford to implement social distancing as the more digitally ready parts of the country were able to; these states house food processing, meatpacking, and poultry processing plants––significantly large employers and industries that provide little opportunity to telecommute or work in a socially distant fashion. The case of Grand Island, Nebraska, a city of just over 50,000, which has a higher rate of COVID-19 cases per capita than New York City is also worth noting. Stay-at home would have been hard to implement in Grand Island. “You can’t pick up a laptop computer and go process beef from your living room,” according to its mayor. One of Grand Island’s key employers is a meatpacking plant that became an infection hotspot.
Some of these rural areas also emerged as hotspots of community spread at the beginning of May owing to added complicating factors such as an absence of adequate public health infrastructure and an abundance of pre-existing comorbid conditions.
On the other end, predominantly rural states such as Kentucky and South Carolina which demonstrated a strong COVID reflex and managed to keep infection rates in check but whose digital reflex and underlying infrastructure are weak and less able to support remote work are now facing the economic brunt of severe job losses. For instance, almost 44% of Kentucky’s workforce filed for unemployment claims, primarily driven by the closure of the state’s manufacturing sector. South Carolina saw unemployment claims reach historic highs, stemming from job losses in the leisure and hospitality industry.
It is important to note that economists are largely supportive of aggressive social distancing policies, particularly in the early part of a pandemic. A study of cities’ economic fortunes following the 1918 flu pandemic found that the cities which exercised more aggressive social distancing policies experienced robust economic recoveries following the pandemic. Nevertheless, the immediate economic impact of shutdowns is a key consideration for all policymakers.
In conclusion, the digital readiness divide across rural and urban America impacts each states’ industry composition, and therefore its flexibility in shifting to remote work during a time of pandemic induced lockdown. This divide leaves policymakers in rural states with an even starker challenge of balancing public health priorities against more immediate economic concerns and public pressure. As the states of the union navigate the Big Easing following the Great Lockdown, understanding and eliminating the digital divide between rural and urban America is key to building resilience and rebuilding the economy.
Research Methodology
Change in Rt from 16 March – 13 May, 2020
The average change in Rt from 16 March – 13 May for the 50 states plus District of Columbia was calculated using Rt numbers by rt.live, where Rt represents the effective reproduction rate of the virus calculated for each locale. It is an estimate of how many secondary infections are likely to occur from a single infection in a specific area. Rt.live updates its methodology and model regularly, our numbers may differ slightly from the most recent version of the model.
Digital Readiness Score
While only part of any economy’s work can be done remotely, Digital Planet examined the 50 states’ “digital reflex” by compiling a Digital Readiness Score for each state plus the District of Columbia. The Digital Readiness Scores are constructed using two indices: Work from Home Readiness; and Inclusive Internet and Digital Public Services.
Work from Home Readiness
In a post-pandemic world, remote working could become the new norm for many people. Realizing that not everyone can work from home, the Work from Home Readiness Index was developed using a range of indicators to assess the extent to which each state’s selected labor force could work from home. Some key measures include the state’s proportion of essential workers, access to technology devices at home, estimated share of the labor force that can work remotely, percent of the population that holds a bachelor’s degree or higher, unemployment claims since March 1, 2020, and the size of the information and services industry. Please refer to the datasheet for a full breakdown of indicator inputs, sources, and weights.
Inclusive Internet and Digital Public Services
While the capacity to work from home is more important than ever, citizens must also be able to access these services reliably, with affordable, and inclusive internet. Broadband coverage, quality, and equity are important prerequisites for remote work. We captured inclusive and affordable internet using BroadbandNow’s research studies and census data from the American Community Survey. Additionally, our inclusive digital public services measure examines how states utilize technology to serve their communities during COVID-19, and factors in qualitative indicators such as the quality of COVID-19 data reporting between March and May, technology development as a priority to state officials, and municipal broadband roadblocks and restrictions. Please refer to the datasheet for a full breakdown of indicator inputs, sources, and weights.
With an unprecedented global pandemic prompting a marked reliance on digital services while workplaces, schools, and government offices remain closed, states who score higher on this axis are presumed to be better equipped to move to online channels during the crisis.
Percentage of Population Living in Rural Areas
The percentage of population living in rural areas across the 50 states plus the District of Columbia was obtained from the 2010 U.S. Census.
All data and sources are available here.


