Results and Discussion
TERT and CDK4 Integration with CRISPR-Cas9
These images depict G418 selection on the BSCs. Cells that express the neomycin resistance gene, which is incorporated in our plasmid, survive while cells that did not undergo successful integration die.
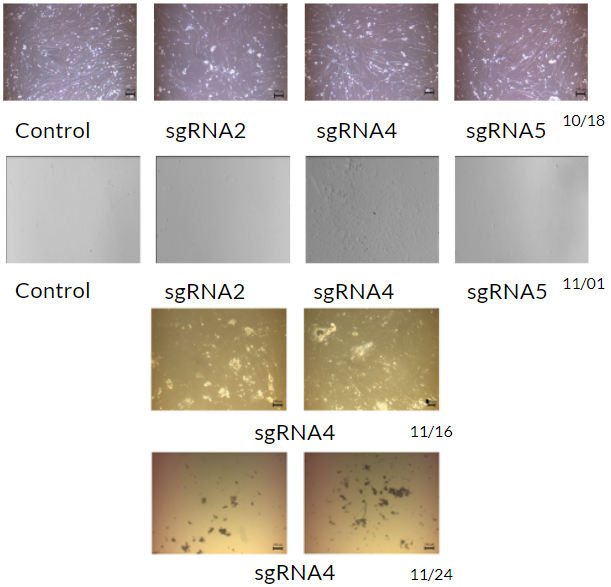
Brightfield images of BSCs at various points following genetic modification using the CRISPR-Cas9 system.
In the above images, it initially appeared as though the control cells were dying faster than any of our modified cells. However, G418 is a relatively slow-acting antibiotic, and after a period of observation (approximately 2 weeks) it seemed that only the cells transfected with sgRNA4 had some relative success. Following another week of media change and observation, even the sgRNA4 transfected cells appeared to have deteriorated. In addition to the deterioration, there was concern that a portion of the remaining BSCs were undergoing differentiation. The next week it appeared as though a rebound might have occurred, but cell morphology still indicated that the cells may have been moving towards senescence, and the week after that almost all of the cells seemed dead.
With all of our modified cells having died at this point, it seems reasonable to infer that the CRISPR-Cas9 system is not capable of transfecting in a plasmid as large as ours. This was a concern from the beginning of the project, as our PI had previously encountered similar results in his experiments. Consequently, we are now moving to retry this transformation using the Sleeping Beauty transposon system. We may also retry CRISPR again using two separate plasmids, one for each of our primary genes of interest, but for now other methods seem more promising.
BSC Characterization Using Pax7 and MF20
Two characterization stains were performed on the BSCs and they were imaged using a Keyence microscope. The first of these was for Pax7, a satellite cell marker, which is shown here in red. For comparison, we also used DAPI to stain for our cell nuclei, seen here in blue, and Phalloidin to stain for actin filaments, seen here in green.
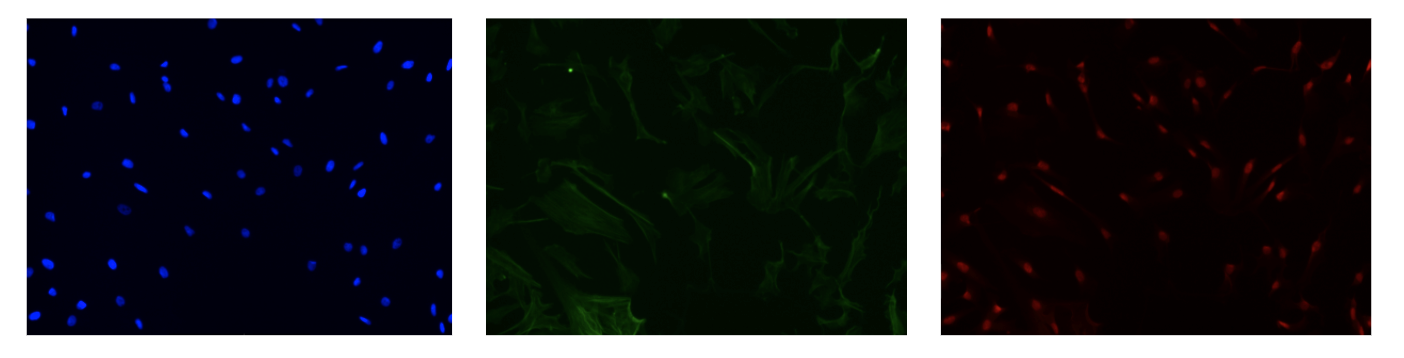
DAPI, Phalloidin, Pax7 stains left to right, 20x.
The second stain was performed using an MF20 antibody to mark Myosin Heavy Chain, and indicator of myogenicity. This stain can be observed on the far right in red, with DAPI and Phalloidin again presented for comparison.

DAPI, Phalloidin, MF20 stain left to right, 20x.
Based on our characterization staining, it appears as though our cells have the expected properties of satellite cells, but the myogenicity stain was inconclusive. It is hypothesized that the absence of MF20 signal was caused by a faulty antibody rather than faulty cells, as our observations of their growth and morphology line up with the expected behavior of muscle cells, but further staining would need to be done to confirm this.