Insulin Resistance Induced by Oxidative Stress
Overview:
The paper, “Reactive oxygen species have a casual role in multiple forms of insulin resistance” [12], provides key information on how intermittent fasting has the potential to mitigate symptoms of Type II diabetes. Oxidative stress is known to impair the ability of insulin to effectively signal to target tissues, leading to the condition of insulin resistance. In this 2006 study, the relationship between oxidative stress and insulin sensitivity was investigated.
Methods:
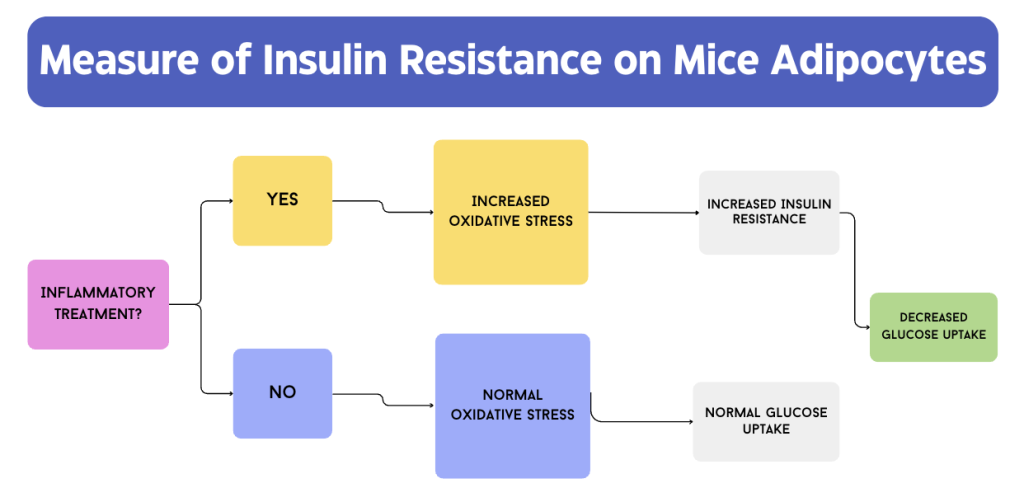
Adipose tissue cells, specifically 3T3-L1 adipocytes of mice, were given two pro-inflammatory treatments to test their impact on insulin resistance: dexamethasone and inflammatory cytokine tumor-necrosis factor-α (TNF). Both of these treatments induce oxidative stress by influencing the expression of genes related to reactive oxygen species (ROS), which can alter the function of many biological molecules [12]. Evidently, giving the adiocytes these treatments would increase oxidative stress when compared to the negative control that did not receive any inflammatory treatment. From here, the efficiacy of insulin can be measured in a state of high oxidative stress. The uptake of 2-deoxyglucose was measured as a marker of insulin resistance. A brief summary of the logic behind this study is represented in Figure 1.
Results & Analysis:
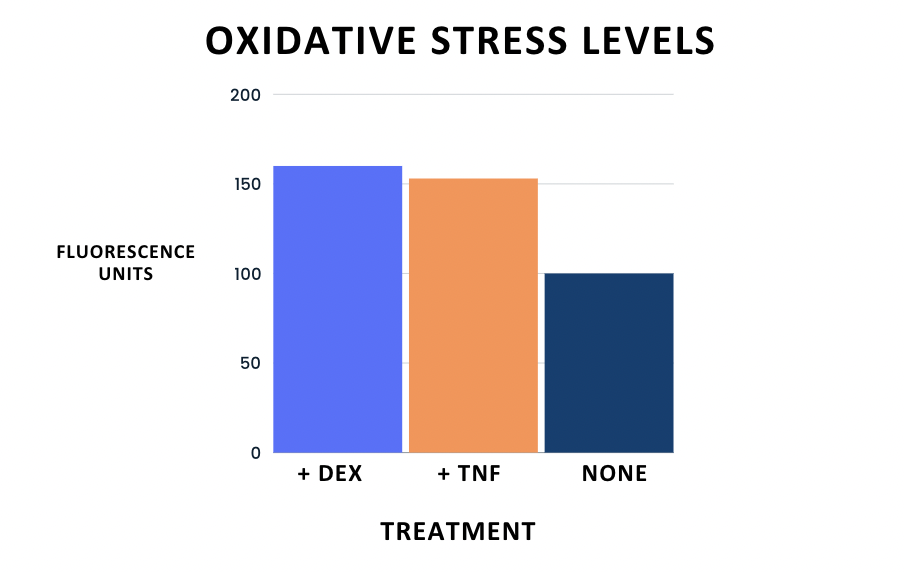
As expected, the experimental groups showed 50-65% higher levels of oxidative stress compared to the negative control, as indicated by a fluorescent redox-sensitive dye. Although each treatment functions through a different signaling mechanism, the outcome of induced expression of ROS-related genes was consistent. In fact, these genes were the highest indicated target for both treatments, showing that both treatments were responsible for inducing oxidative stress in the 3T3-L1 mice adipocytes.
In terms of insulin resistance, the induced oxidative stress had a clear impact on the glucose uptake of the cultured cells. More specifically, the experimental groups “became insulin resistant within several days” [12]. The treatment groups showed significantly decreased levels of glucose uptake when compared to the negative control, as demonstrated below in Figures 2 and 3.


Significance & Connection to Type II Diabetes:
Evidently, pro-inflammatory molecules that correspond to high oxidative stress levels lead to increased insulin resistance in 3T3-L1 adipocytes of mice. As mentioned in the paper, ROS are by-products of cellular respiration in mitochondria, which is an active process in the fed state. An intermittent fasting regimen would introduce periods of fasting in between feeding, allowing for the accumulation of oxidative species to be dealt with. Additionally, fasting allows for the formation of ketone bodies that play a major role in combating oxidative stress that is introduced in the fed state. This molecular pathway is described in the ketone body reduction of oxidative stress section. In conclusion, this paper provided us with essential information in understanding one of the molecular causes of insulin resistance, oxidative stress, and inspired our ideas on how intermittent fasting can make an impact on it.

December 4, 2023 at 5:53 pm
The information on this page is incredibly relevant to your other pages, and to your research topic as a whole. The impact of ROS on insulin resistance in mice cannot be understated. It may be worthwhile to mention specifically that these relationships are strongly correlated in mice, but further research needs to occur to see the same results and trends in the human body. How do human vs. mice insulin/glucagon pathways differ? Mentioning similarities/differences between these pathways between our bodies and within mice may provide this summary with more relevance to our own bodies. Good work!
December 5, 2023 at 2:16 am
Great choice of paper in further exploring the effects of oxidative stress in inducing insulin resistance. However, it seems that there might be an inaccuracy in the adaptation of Figure 2 from the original paper, “Reactive oxygen species have a casual role in multiple forms of insulin resistance” by Houstis et al. In the original Figure (1), which characterizes the insulin-resistant state, the treatment of TNF and DEX is reported to lead to a decrease in (%) uptake of 2-Deoxyglucose. This makes sense as since these inflammatory treatments are able to mimic the effects of oxidative stress (through the expression of genes related to reactive oxygen species (ROS)), there should be a noticeable drop in uptake of glucose molecules, provided oxidative stress leads to insulin resistance. However, in the adapted figure, the bar graph instead shows an increase in 2-Deoxyglucose for both +TNF and +Dex relative to the negative control. Aside from this minor error, the paper was interpreted really well and was extremely relevant to the topic being studied. Nice job!
December 14, 2023 at 6:06 pm
Hi Pun! Great catch – I mixed up the columns for the bar graph and totally missed it. I have changed them to more accurately reflect the results from the paper. Thank you so much!
December 5, 2023 at 5:08 pm
The flowchart was super informative in effectively summarizing the effects of glucose uptake based on whether or not the mice were given either dexamethasone or TNF. I think you could elaborate on the part in the “Results & Analysis” section, where you mentioned that “these genes were the highest indicated target for both treatments”. How was this indication expressed? You mention that oxidative stress was assessed via a fluorescent redox-sensitive dye, so do you mean that there is maximum fluorescence? Are these fluorophores that are in some way conjugated to the specific genes? Some clarification would be great. There are also some minor grammatical errors in the methods section, “efficiacy” and “adiocytes.” But overall great work!
December 8, 2023 at 6:58 pm
I loved the simplicity of the methods section and Figure 1 associated. I think you could have briefly explained at the end of the sentence what fluorescent redox-sensitive dye was used to establish credibility with readers. The results definitely suggest that oxidative stress can lead to insulin resistance, but I feel the pathway is not fully understood from this paper. Perhaps, if it is known, explaining in more detail why oxidative stress causes resistance in a more specific sense would be elucidating.
December 10, 2023 at 5:24 pm
Excellent summary of the study’s methodology in figure 1 and relevant findings in figure 2. I think the color coding in figures 2 and 3 was a bit confusing due to the colors changing between treatment groups, but the labelling was clear. I also think presenting oxidative stress levels before % uptake would provide a better flow. I agree with the feedback from my group members who noticed higher % uptake under treatment conditions compared to the control and washout (figure 2) which does not align with the text. Overall, I think the paper was well reviewed and of great significance to your topic.
December 14, 2023 at 6:07 pm
Hi Sam! Thank you for your feedback. I changed the columns on the bar chart in figure 1 so they accurately reflect the results. Additionally, I changed the colors around so each treatment stuck with the same color for both figures. I appreciate your feedback!!