2. Ketone Body Reduction of Oxidative Stress
Intermittent fasting, or time-restricted eating, has become increasingly popular as a way to attenuate the effects of insulin resistance, a major attribute of type II diabetes mellitus. More specifically, intermittent fasting can mitigate insulin resistance by way of ketone body reduction of oxidative stress in the body.
Oxidative stress is a condition that occurs when there is a buildup of reactive oxygen species (ROS) within cells. ROS are dangerous and cause harm to many tissues, as their oxidative powers can alter the structure and functionality of important biological molecules. High oxidative stress impairs the ability of insulin to effectively signal glucose uptake and mobilization in target tissues. A 2006 study investigated the relationship between oxidative stress and insulin sensitivity in adipocytes of mice, and found that inducing oxidative stress causes cells to become insulin resistant [12]. More on this paper is described in the insulin resistance induced by oxidative stress section.
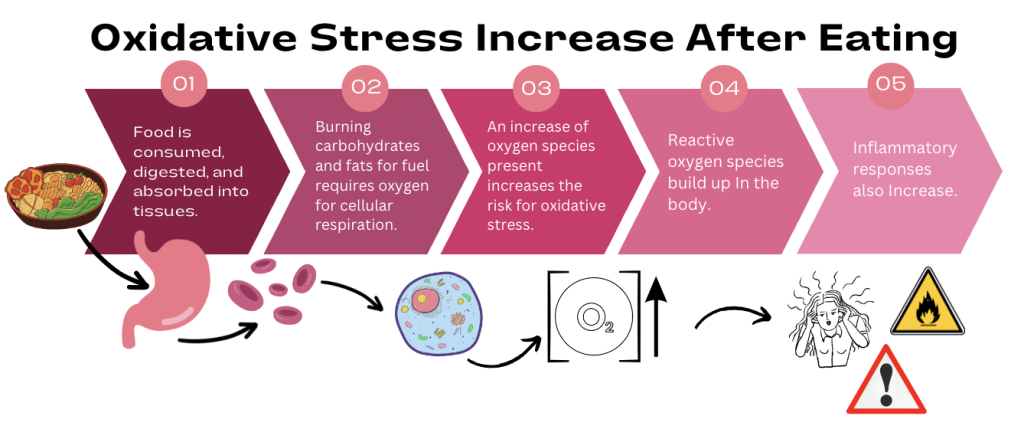
Several oxidative processes are related to energy consumption, or more simply, eating. Cellular respiration is the metabolic process by which energy is extracted from ingested food through a series of oxidative steps. Additionally, the postprandial cellular state (after eating lunch or dinner) has shown to increase oxidative stress in mitochondria [13]. In more simple terms, eating and overeating increase cellular oxidative stress through oxidative metabolic processes, as shown below in Figure 1. Intermittent fasting plays a key role in reducing these stress levels to improve insulin sensitivity, and relies on the production of ketone bodies in the liver.
Intermittent fasting restricts the eating window to about 8-10 hours each day, leaving the remaining 14-16 hours to induce the cellular “fasted” state. After about 12 hours without eating, glycogen stores in the liver become depleted. At this point, this organ switches to gluconeogenesis and beta-oxidation to further supply energy for the body. A diagram that demonstrates the relative timing of each of these metabolic pathways is shown here. In muscle cells, fats are primarily broken down into acetyl CoA, which can enter the Citric Acid Cycle and used to produce ATP [14]. However, liver cells instead use beta-oxidation to primarily synthesize ketone bodies to be used for energy by neurons in the brain and heart muscle cells.
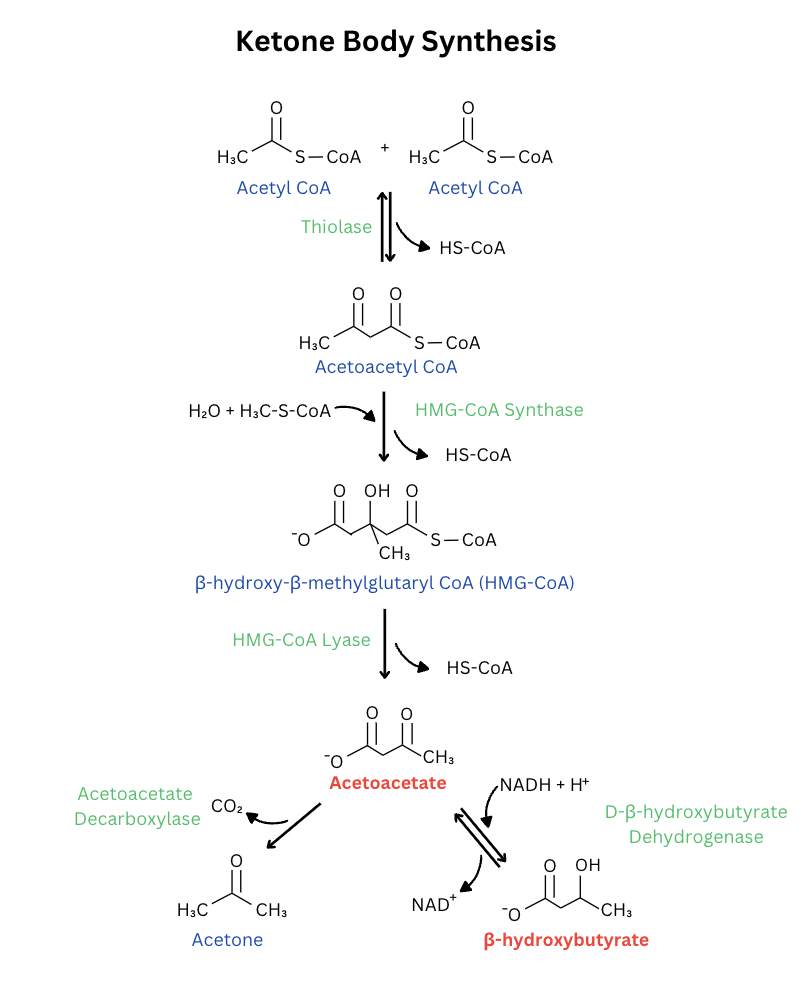
Ketone body synthesis in the liver leads to the production of acetoacetate and beta-hydroxybutyrate, each from two acetyl CoA molecules [15]. The synthesis of these two ketones is shown below in Figure 2.

Some ketone bodies are directly involved in redox homeostasis and combating oxidative stress in the body. The synthesis and mechanism of action of these ketone bodies is shown here. In summary, beta-hydroxybutyrate acts as a direct antioxidant and promotes transcription of antioxidant enzymes (FOXO1, FOXO3a, NRF2), therefore suppressing ROS present in mitochondria and other parts of the cell [17]. Figure 3 below demonstrates the various ways in which beta-hydroxybutyrate can fight oxidative stress after its production in the liver.

A time-restricted feeding regimen leads to an increase in ketone body production during the fasted state. This biological pathway describes the mechanism of action of ketone bodies on oxidative stress and in turn, insulin resistance. Beta-hydroxybutyrate is known to combat reactive oxidants through both indirect and direct mechanisms, as displayed in figure 3. High cellular oxidative stress leads to increased insulin resistance, thus ketone body production is a way to reduce this resistance and improve the pathologies of type II diabetes.

December 4, 2023 at 1:00 pm
Awesome page! I noticed that you jump from a “Figure 1” straight into a “Figure 3”, it might be worth it to change that small detail. I also found “Figure 1” number 5 on the far right side to be slightly difficult to read, again a minor detail that doesn’t really matter. You guys have a ton of great info on this page and made it super understandable for non-biochemists. Fantastic job.
December 13, 2023 at 6:27 pm
Hi Ryan! Thank you so much for catching the numbering on the figures…. haha. I re-numbered them to be in the correct order now. I agree with your note on figure 1 being hard to read, so I changed the colorway on it and increased the font so hopefully it is more clear.
December 5, 2023 at 2:14 am
I think this page is a great example of how a connective sentence or paragraph is really helpful in improving the flow of the website. I thought the first paragraph was a really well written way of reiterating the idea of time-restricting eating from the last mechanism page and how it connects to solving issues of insulin induced resistance via oxidative stress. Overall, the contents of this page are filled with great information, which is thoughtfully organized through the interjection of visually appealing reaction pathways and diagrams. This, in turn, contributes to the page flowing very clearly and cohesively. On a very small note, in the third paragraph, it mentions that “Intermittent fasting plays a key role in reducing these stress levels to improve insulin resistance,” but if I’m not wrong I think it should say reducing stress levels improve insulin sensitivity. Overall, awesome work!
December 13, 2023 at 6:31 pm
Hey Pun! Thank you so much for your kind and helpful feedback. I agree with your comment on changing the “resistance” to “sensitivity” in the third paragraph and changed it.
December 5, 2023 at 2:20 am
This is a fantastic explanation. Your numerous mentionings of putting intricate concepts in simple terms really helps with the overall clarity and integration of the scientific literature. I especially enjoyed your timeline involving the effects of reactive oxygen species after eating. Initially I was going to suggest that it might be helpful to construct a similar diagram that describes when exactly the cellular “fasted state,” gluconeogenesis, and beta oxidation occur as seen in the paragraph below the oxidative stress diagram, with the specific hour windows that you mentioned. But after reading your third “Recent Research” article, I suggest hyperlinking the section where you mention that process to the graph itself.
Also one small thing to note: I might be wrong, but it seems you made the diagram for ketone body synthesis rather than simply taking it from the primary literature. Be sure to write “Adapted from [15]” rather than just [15]. Your diagram looks a lot nicer anyways 🙂
December 13, 2023 at 6:34 pm
Hi Andy! I added a quick sentence and link to the graph that shows the timing of each metabolic pathway, and think it is a good connection for readers to have that there. Also, I changed the citation for figure 2. Thank you so much for you feedback!!!
December 8, 2023 at 5:47 pm
I was completely unaware that ketone bodies can act as anti-oxidants. The page is straightforward to read and follows a nice set of logical events. I liked the background given on ROS, but I think you could have made it more obvious that oxygen, which is used for aerobic respiration, is the primary cause of oxidative stress. Also, although you hyperlinked to another page explaining why ROS can interfere with insulin, I would have liked a very brief explanation, like a sentence, on this page as well.
December 10, 2023 at 5:18 pm
I really appreciate the second paragraph that very clearly establish the relation between oxidative stress and insulin resistance. As I continued reading, the first question that came to mind was, “is the fasting window long enough to deplete glycogen storage and for other metabolic processes to rise?” My question was answered in the paragraph that directly followed it. It’s clear how intermittent fasting limits oxidative stress, through increased production of ketone bodies, more specifically, beta-hydroxybutyrate. I think the information in this page was excellently presented. I don’t think it’s easy to write a page that contains the mechanistic details to gauge the interest of a biochemist along with making it understandable to a non-biochemist. In combination with appealing diagrams, this page does that. Awesome!