The Stockholm International Peace Research Institute (SIPRI) released its latest data on the international arms trade on Monday 12th March. The data show a continuing growth in the global trade in major conventional weapons, with the volume of transfers from 2013-2017 being 10% higher than it was over 2008-2012.
SIPRI arms trade data (like all data really) needs a few interpretative notes (see SIPRI’s sources and methods for more details):
- It measures the trade in “major conventional weapons”. This includes military aircraft (including UAVs), ships (except very small ones), tanks, armored vehicles, artillery, missiles and air defense systems, military surveillance satellites, as well as certain major subsystems: engines, radar and other sensor systems, and tank turrets. It does not include small arms & light weapons, ammunition, military communications equipment and satellites, and all other components and subsystems. It also does not cover the trade in military services, such as maintenance, repair and overhaul, training, etc.
- SIPRI data is not a financial measure. The figures presented, “Trend Indicator Values” (TIV) do not represent dollars in any direct sense. The idea is to measure the volume of transfers, giving a similar weight to similar systems. The TIV values are based around a set of “core systems”, made in the US, that are given a TIV based on their unit production cost, expressed in constant 1990 US dollars. Other systems are given a TIV based on a judgment as to the nearest equivalent US system. Adjustments are made for systems that are second-hand or refurbished.
What does this mean in practice? Compared to the financial value of the arms trade, the SIPRI measure probably gives relatively lower figures to the exports of the UK, for whom military services (especially to Saudi Arabia) are a major source of revenue for the arms industry, and Israel, which sells a lot of high-tech components and subsystems. On the other hand, it probably gives relatively higher figures, compared to the financial value, to Russian and Chinese exports, as production costs for their systems are probably lower than for the equivalent US systems.
What SIPRI’s TIV data does do is provide the only reliable international and inter-temporal comparison of arms transfers for all countries, due to the complete lack of official data for Chinese exports, the very limited data for some other countries’ exports (e.g. Russia and Israel, where only a total is provided), and the major divergence in the reporting systems of other countries that do provide more detail.
Moreover, the SIPRI database provides a comprehensive register—the only one available publicly—of all major conventional arms transfers between every pair of countries – the actual equipment sold, with details of each deal.
With all this in mind, what is there to say about the latest SIPRI data? SIPRI’s own fact sheet tells us many of the key points, so I will just elaborate on a few.
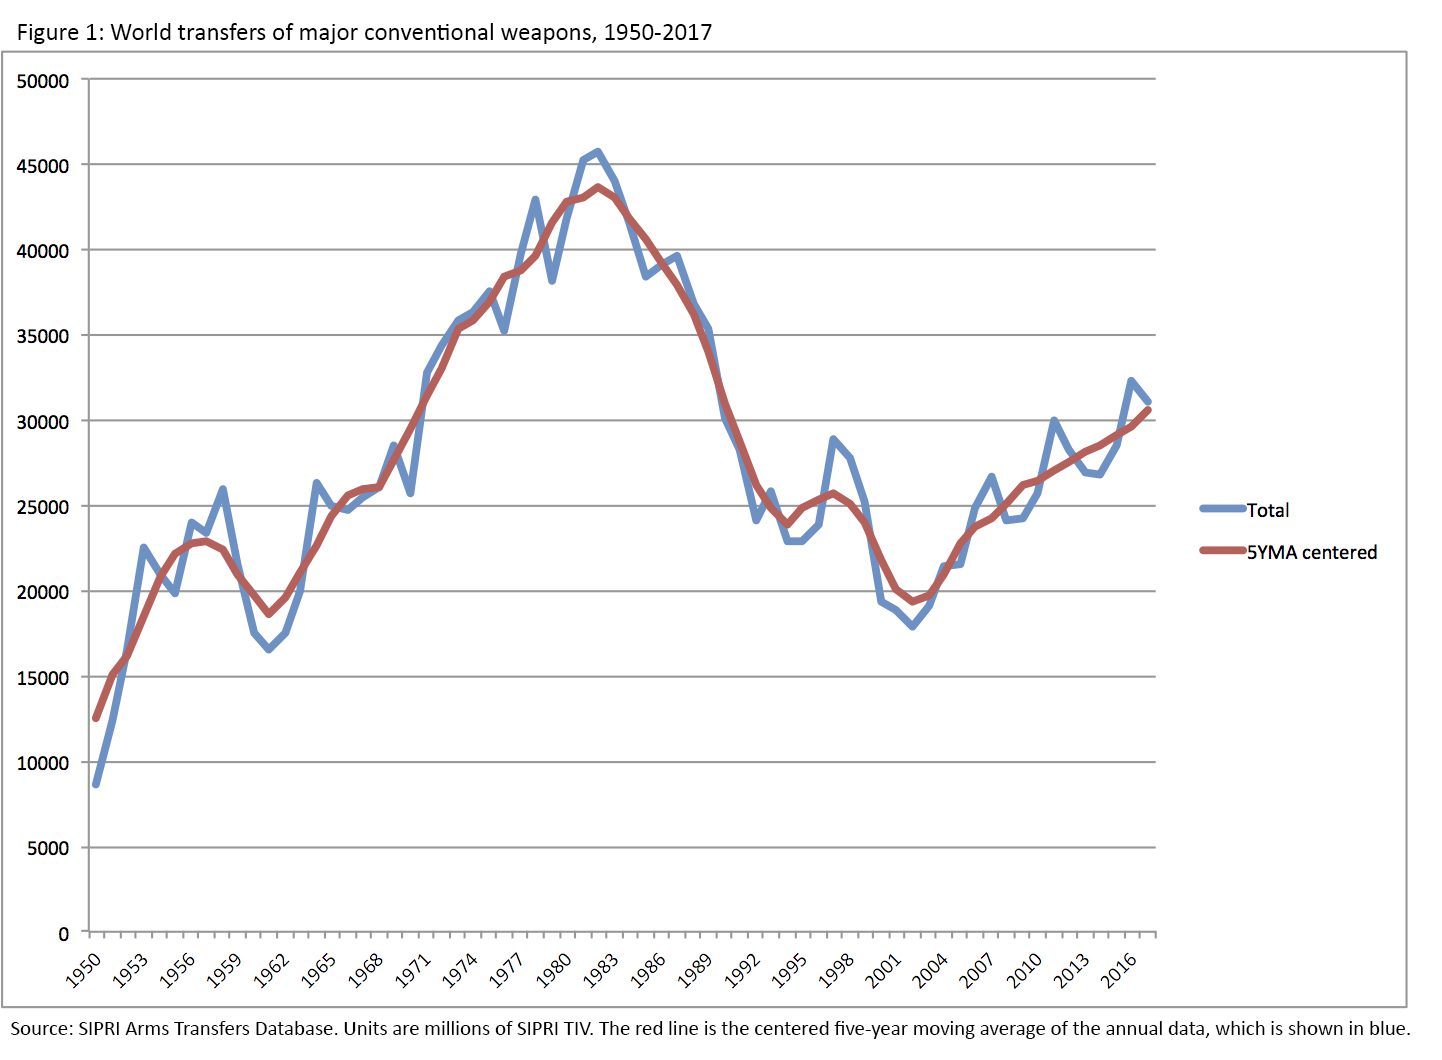
First of all, the trend continues to be up. SIPRI compares the most recent five years, from 2013-2017, with the previous five, 2008-2012, for its 10% headline growth figure, but this does not tell us that much, as the figures for 2013-2016 were already high enough to all but guarantee an increase. In fact, the total for 2017 is slightly lower than that for 2016, but is still higher than in any other year since 1989. SIPRI’s 5-year moving average shows a continued increase in the trend in 2017; I use a slightly different measure, a centered 5-year average,[1] which also shows an increase (see figure 1).
 Secondly, the growth in arms transfers to the Middle East is deeply concerning, reflecting a ramping up of conflict and tensions, and possibly portending more to come. At around 35%, the Middle East’s share of global transfers is the highest it has ever been; as high as or higher than at any point in the Iran-Iraq war, or the massive oil-fuelled arms-buying spree in the 1970s, in the wake of the Yom Kippur war. Saudi Arabia in particular has more than trebled its arms imports over 2013-2017, compared with 2008-2012, and in 2017 was the single largest recipient of arms worldwide—although India retains the number one position over the 5-year period. Egypt’s military dictatorship is also buying arms like there’s no tomorrow. The old assumption, as the Arab-Israeli conflict declined as a state-to-state affair from the 1980s, that many of these countries are buying arms mostly for prestige, show, and kickback opportunities, clearly no longer applies with the Saudi-led war in Yemen, and the huge growth in arms purchases—with still more major orders in the pipeline—must raise serious fears that these are being bought with the intention of being used. Possibly against Iran?
Meanwhile the major arms producers, in particular the US, Russia, the UK and France, are showing precisely zero restraint in seeking to supply the insatiable demand for arms in the Middle East. All are seeking to cash in as much as possible on the booming market, without thought to the actual and potential future consequences. (Russia’s sales to the region in TIV terms are pretty low, but they are the key supplier for both Iran and Syria, the latter being small in volume terms but highly significant in its effect on the conflict).
On the exporter side, 2017 saw a one-year surge in deliveries by the US, but while the overall trend for the number one exporter is not so dramatic, it is still up. One interesting longer-term trend—again, in spite of a single-year dip—is the share of arms exports accounted for by countries outside the traditional arms-producing regions of Europe (including Russia) and North America. Over the last few years, this has averaged around 14% of the total, compared to just about 5% during the late 1990s. Four countries in particular: China, Israel, South Korea, and Turkey, have driven this trend, being clearly the most successful ‘emerging’ arms producers and traders. (See figure 2).
 Any positive news to be gleaned from the data? Well, arms imports by Latin America and sub-Saharan Africa are declining, with levels at their lowest since the mid-1990s. In the case of Latin America, this is largely due to the collapse of the Venezuelan economy, which has brought the country’s previously high level of acquisitions to a grinding halt. In sub-Saharan Africa, the decline comes despite generally much rosier economic conditions than pertained 20-30 years ago, although some of the region’s larger buyers, South Africa and Nigeria, are doing much less well. Meanwhile, devastating conflicts are continuing in CAR, DRC, and South Sudan, without significant additions of new major arms.
For the most part, global militarization is proceeding apace.
[1] The SIPRI trend line shows the average of the current year and the four previous year; the centered average in figure 1 shows the average of the five years starting from 2 years before the year in question, to 2 years after; the last two figures give the average from 2014-2017 and 2015-2017 respectively.