Determinants of Cardiac Performance
By Dr. Vicky Yang
Revised from original syllabus by Dr. Donald Brown
OBJECTIVES
- Know the definition of preload, afterload, contractility, and distensibility, and how they affect stroke volume and cardiac output
- Understand the Frank-Starling law
- Know the definition of wall stress and how the heart can remodel in an attempt to decrease wall stress
- Know how the “normal” and “sick” hearts are affected by preload and afterload
- Know how the cardiovascular system meet higher oxygen demands during exercise or to maintain normal oxygen delivery with heart disease
I. Determinants of Cardiac Performance
In the course of daily function, mammalian physiological systems adapt dramatically to changing needs for exercise, digestion, thought, etc. The determinants of cardiac performance comprise the variables that can be altered to bring about immediate changes in heart function. These determinants include preload, afterload, contractility, distensibility, heart rate, and synergy of contraction. The determinants typically are altered by the system in concert, i.e., multiple adaptations at once, and are beneficial for short-term adaptations but may be at a cost to for the long term (detrimental or undesirable effects).
Some of the determinants are readily considered in terms of the pressure-volume loop described in the normal cardiovascular physiology. This is one of the better models of cardiac function and revolves around the concept of compliance pumping where the heart cycles with a changing relationship between pressure and volume over the course of the cardiac cycle; we will concentrate mostly on the left ventricle to illustrate the concepts.
During diastole, after the myocardium has relaxed entirely, the ventricle has an intrinsic end- diastolic pressure volume relationship (EDPVR), a curve that relates the heart’s blood volume to its distending pressure at the end of diastole, or full relaxation, as shown in Figure 1.
It is crucial to understand that this EDPVR pressure volume curve is based on the relationship between pressure and volume at end diastole only. As we will soon examine, the pressure volume relationship changes at each point in the cardiac cycle. The EDPVR curve is not typically a straight-line; the relaxed heart gets “stiffer” as blood volume is added, so that adding a little bit additional blood causes the pressure to increase to a greater extent if the heart is already pretty full (i.e., at higher volumes). This curve represents the distensibility or compliance of the cardiac chamber, defined as change in volume over change in pressure (inverse of the slope of the curve). Also note that compliance is inversely related to elastance or stiffness.

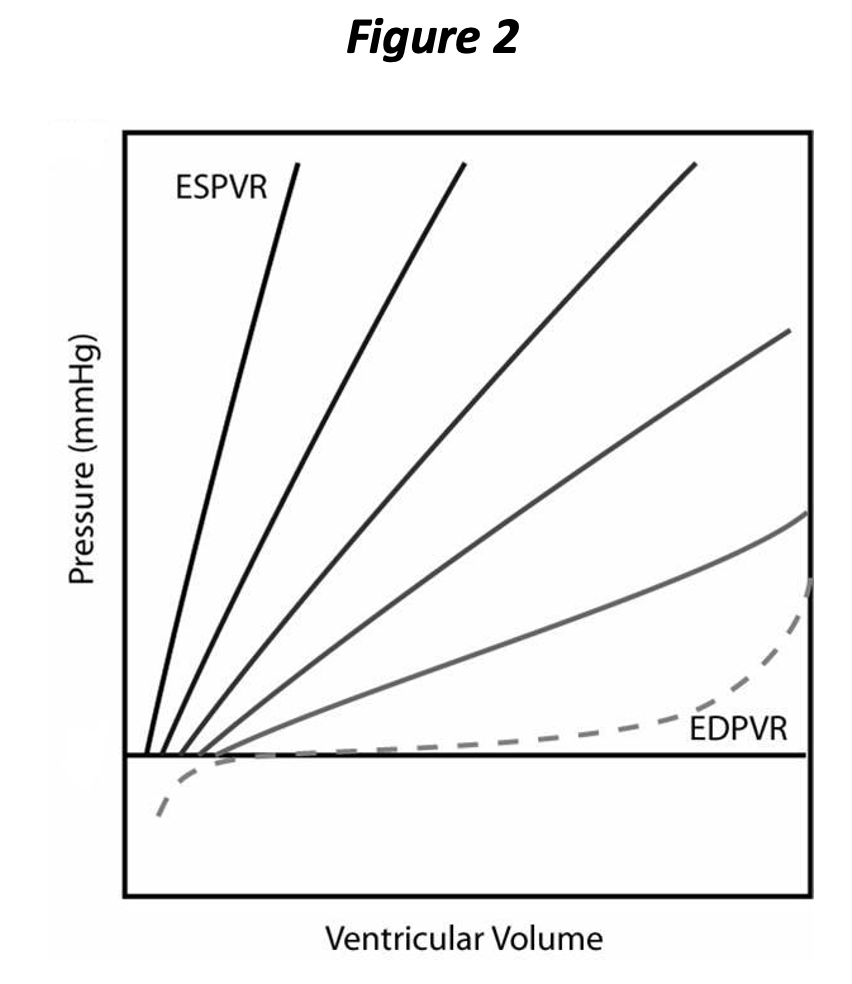
When the heart chamber begins to “contract”, the relationship between pressure and volume changes. At maximal contraction, the curve is called the end systolic pressure volume relationship (ESPVR), and we will see shortly that this is an important aspect of contractility, another determinant of cardiac performance. Figure 2 depicts both the EDPVR and ESPVR, with four intermediate PVR curves shown occurring between end diastole and end systole. As noted by the intermediate PVR curves, the relationship between pressure and volume is changing constantly during the cardiac cycle, until, at the very end, that the ESPVR is reached. When we are considering contractility, we can ignore all of the intermediate PVR curves, since it is a factor determined at the end of contraction.
The PVR changes
throughout the cardiac cycle and returns to the EDPVR subsequent to complete relaxation (again, we are going to ignore all of the intermediate PVRs for the purpose
of our discussion). It will now be
apparent that the EDPVR represents the extent
of relaxation and the ESPVR represents the extent of contraction. Neither
the rate of contraction nor the rate of relaxation is represented above. Both contraction and relaxation have at
least two
aspects, i.e., extent and rate. You can think of rate as how rapidly the chamber cycles between the PVR curves in the above graph. Rate of contraction and relaxation is tied to energy availability and the metabolic “machinery” involved in calcium release and sequestration; calcium must be pumped back into the sarcoplasmic reticulum for relaxation to occur.
Damaged myocytes (e.g., ischemia) may lead to a loss in the ability to contract and relax adequately, leaving them in a state of relative rigor (as in rigor mortis!)
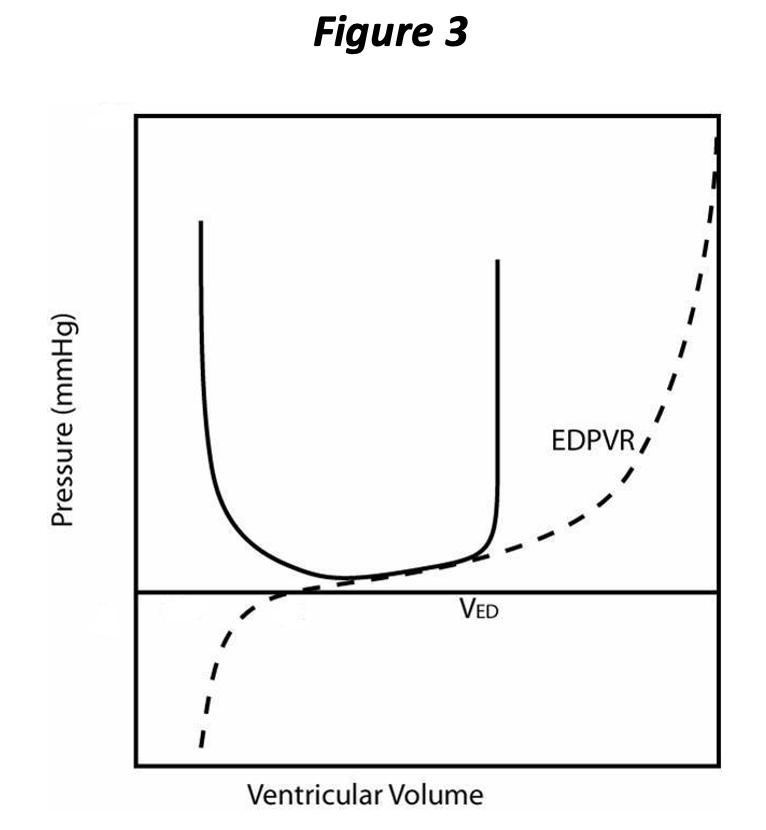
During diastole and after the heart is fully relaxed, blood returns to the ventricle from the corresponding atrium. Just before the ventricle begins to contract, it has attained its maximal volume for that cardiac cycle, referred to as the end diastolic volume (EDV, VED in Figure 3), which corresponds to an end diastolic pressure (EDP).
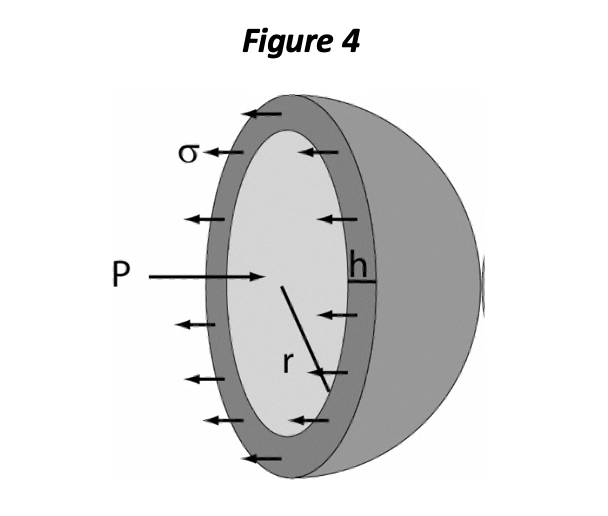
Either EDP or EDV may be considered as representing the preload of the ventricle, and various authors have argued in favor of one definition over the other. However, the importance of preload is manifested at the level of the sarcomere and depends consequently on a number of factors, including the stiffness of the myocardial tissue itself and the chamber geometry. One of the important aspects of chamber geometry is the relative wall thickness, which can be represented as the ratio of wall thickness (h) to chamber radius (r). The LaPlace relationship for mechanical wall stress (σ) states:
<J = Pr/2h
The equation shows that with greater chamber pressure (P), OR with increased r/h ratio, sarcomeres are subjected to greater distending force (σ) and must exert more force per sarcomere to generate chamber pressure. In a pure sense, diastolic wall stress is the best definition of preload. You can think of wall stress as the distending force per sarcomeric unit, if the heart is in diastole, or the force that each sarcomere must produce to generate pressure within the chamber (in systole).
Up to an optimal length, cardiac sarcomeres respond to increasing length with increasing force and rate of contraction. This phenomenon is the principal basis for the Frank-Starling law of the heart: increasing preload increases stroke volume (other things being equal). The underlying basis for the Frank-Starling mechanism is not known entirely; increasing stretch of the sarcomeres increases calcium sensitivity and availability for contraction through poorly understood mechanisms.
With the onset of contraction, the valves of the normal ventricle are sealed and so the volume remains constant during the isovolumic contraction phase. With volume fixed, changes in pressure within the chamber are due entirely to the changing PVR; the pressure increases rapidly at a rate that depends upon both the rate of contraction and the initial filling, i.e., preload, of the ventricle. This is represented on the pressure volume loop as the vertical part in Figure 3, directly above VED, and corresponds to isovolumic contraction.
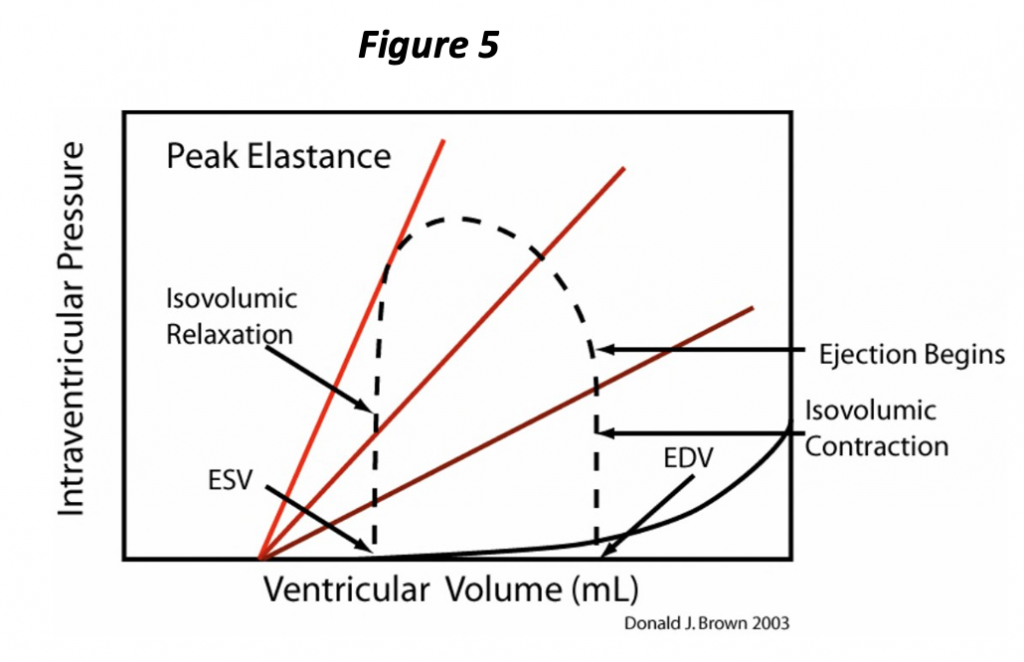
Isovolumic contraction ends when ventricular pressure exceeds that of the aorta (or pulmonary artery if discussing the right ventricle). With opening of the semi-lunar valve, the ventricle begins to eject blood into the great artery. The volume of the ventricle and the pressure within the ventricle begin to decrease (Figure 5). The pressure is partly determined by the volume of blood remaining within the ventricle, but also by the “resistance” to pushing the blood out of the blood into the artery, or the afterload.
There are various proposed
definitions for afterload. In the purest
sense, it should be thought
of as systolic wall stress. We will
talk about it simply as the pressure the heart ejects against
when considering P-V loops. This allows “afterload” to be readily ascertained from the pressure recording alone. The disadvantage of this approach is that the heart affects its own afterload under this definition, since the pressure results from a specific heart contracting against a specific circulation, so that afterload is not defined independently from the heart and circumstances; i.e., ejection pressure can stay the same even though vasoconstriction or vasodilation has occurred depending on whether cardiac output has changed. In any case, and for any definition, afterload is inversely related to stroke volume; as afterload increases, ESV increases and stroke volume decreases for a given heart. In other words, increasing the pressure that the heart ejects against impairs its ability to empty. In a dilated heart, i.e., with increased radius to wall thickness ratio, sarcomeres are under greater wall stress and must generate greater force to produce a particular pressure (LaPlace relationship). Wall stress is one of the primary determinants of myocardial oxygen requirements. This wall stress is also one of the signals for myocardial hypertrophy which is elicited through complex biochemical pathways. Hypertrophy acts to increase the relative wall thickness and return wall stress towards normal.
Let’s try to summarize the pressure-volume cycle of the heart. The heart ejects and decreases its volume throughout systole, and the PVR continues to change during this interval; with further “contraction,” the chamber holds less volume at any given pressure. This process continues until the heart attains the full extent of contraction at the ESPVR. Very near this point in the pressure volume loop, the semi lunar valves close and the ventricle is once again in an isovolumic state. At this time, isovolumic relaxation begins to occur, corresponding to the vertical part of the loop just above the end systolic volume (ESV, Figure 5), and pressure changes are due entirely to the changing ventricular PVR. The rate of pressure decrease is attributable to both the rate of relaxation (rate of change of the PVR) and also to the ESV. As soon as ventricular pressure falls below atrial pressure, the atrioventricular valves open and ventricular volume begins to increase. The ventricle finally returns to the fully relaxed state, the EDPVR. As the heart is once again being filled (increase in volume), the pressure increases in accordance with the EDPVR, and the cycle repeats.
Notice that the PV loop (Figure 5) illustrates and allows determination of several of the determinants of cardiac performance. We have already seen that the preload is represented by the EDP or EDV, which is evident at the lower right “corner” of the loop. The afterload is simply the pressure the heart ejects against; we will simplify this concept further and consider the afterload as the pressure at end systole (ESP), i.e., the pressure at the upper left “corner” of the loop corresponding to the ESV on the ESPVR. The ESPVR represents the extent of contraction and corresponds to this aspect of contractility. The ESPVR often is simplified as a straight line whose slope defines contractility. The slope of this line has units of pressure divided by volume, a physical quantity known as elastance and is represented by the letter E. Hence the maximum slope of the PVR occurs at end systole, the ESPVR, and is known as Emax. Notice also that the stroke volume of the ventricle is represented on the plot as the difference between the EDV and the ESV.
Understanding
this model provides an invaluable framework from which to interpret
physiological and pathophysiological changes. Consider now the effect of changing
preload in a given heart (constant distensibility,
contractility, and afterload).
Now, let us explore how changing preload, afterload, contractility, distensibility might change the performance of the heart.
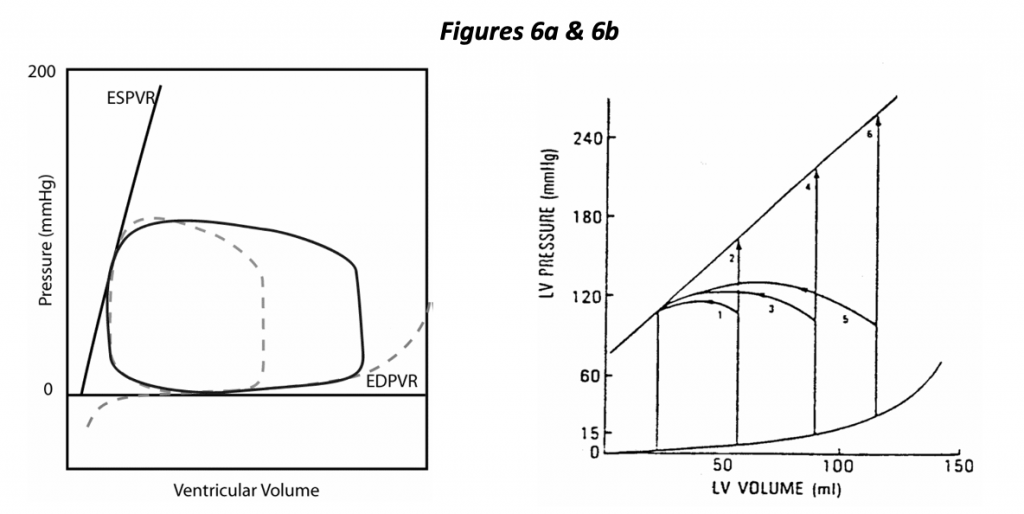
In the left hand diagram (Figure 6a), the control loop is shown as a dotted line, and a dramatic change in preload is depicted. In this case, increasing EDV results in increased stroke volume. A highly distensible ventricle is illustrated, one in which increased EDV results in a small increase in EDP. It so happens that a minor change in preload (EDP) has a dramatic effect on stroke volume in this depiction of a normal heart. The normal heart is said to be “preload dependent”, i.e., small changes in preload can have a dramatic effect on stroke volume.
The right hand diagram (Figure 6b) illustrates the effects of changing preload and afterload with fixed contractility. Isovolumic beats are shown in which the heart ejects against a cross- clamped aorta (infinite impedance). The diagram shows that we expect the heart to generate greater isovolumic pressure with increasing preload as well as greater stroke volume at any fixed ejection pressure (afterload).
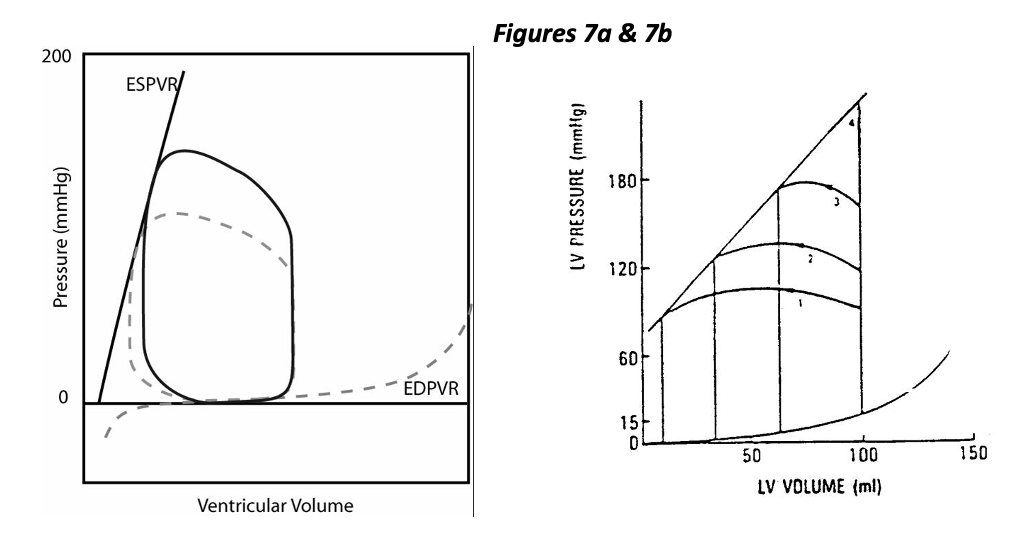
While the normal heart is said to be preload dependent, it is relatively “afterload independent”. Figure 7a represents the effect of increased afterload with constant contractility, distensibility, and preload. This condition could result from vasoconstriction and an increase in vascular resistance (or impedance). As you can see, ejection pressure is increased (by design), and stroke volume is decreased. The decrease in stroke volume is mild in this example of a normal heart. The right hand figure 7b shows a wide range of stroke volumes generated by a heart with fixed preload and contractility but variable afterload. Increasing afterload decreases stroke volume, specifically by increasing ESV.
Consider now the result of decreased contractility as the initiating cause of heart disease, in terms of the determinants of cardiac performance. In Figure 8a below, the control condition appears as a dotted line and the solid line illustrates the loop resulting from decreased contractility. Other things being equal (preload, afterload, etc.), stroke volume decreases following a decrease in contractility. The body may compensate for this circumstance in several ways, one being to increase preload to return stroke volume towards normal (Figure 8b). It should also be noted that decreased stroke volume alone results in decreased cardiac output.
Within a given heart, decreased contractility results in decreased stroke volume due specifically to increased ESV. Compensatory mechanisms are activated to increase heart rate, preload and vasoconstriction (to maintain stroke volume and blood pressure) and also to correct the loss of contractility (sympathetic stimulation).

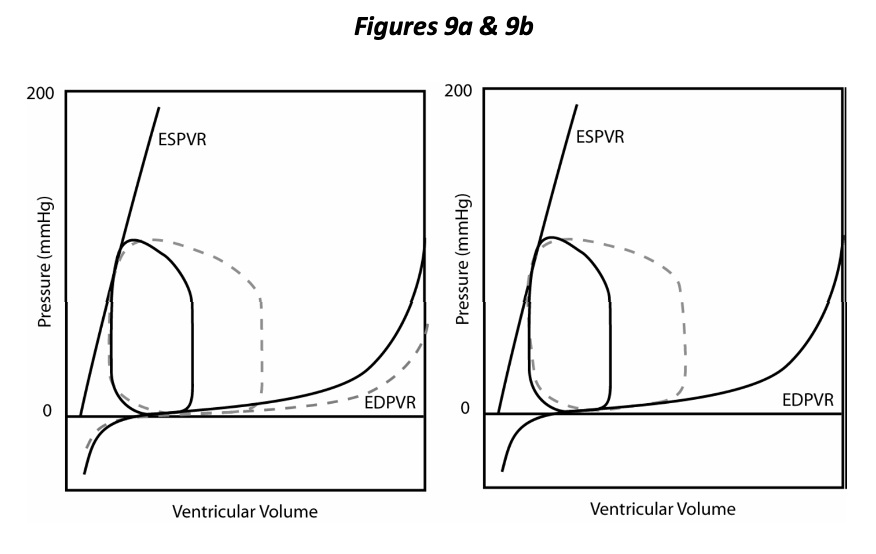
In Figure 9a we compare the PV loop resulting from decreased distensibility with the control (dotted line), other things being equal (preload, afterload and contractility). Decreased distensibility and an inability to relax compromises overall cardiac function just as does decreased ability to contract (contractility). Decreased rate and extent of relaxation of the ventricle is a component of many cardiovascular diseases; diastolic dysfunction is the term applied to this situation. Figure 9b shows that the resulting decreased stroke volume can be improved by increasing preload (EDP). Hence either systolic or diastolic dysfunction may bring about an increase in preload as a compensatory mechanism invoked by the body to return stroke volume towards normal. Congestion is the pathological elevation of venous pressure and most typically results from cardiac dysfunction and the compensatory fluid retention that is invoked (congestive heart failure). Diastolic dysfunction/decreased distensibility results in decreased stroke volume, specifically due to a decrease in EDV. Compensatory mechanisms are invoked to increase preload with consequent congestion.
Not directly evident from the P-V loop are the two remaining determinants of cardiac performance: heart rate and synergy of contraction. Heart rate has a rather obvious effect on performance:
CO = SV × HR
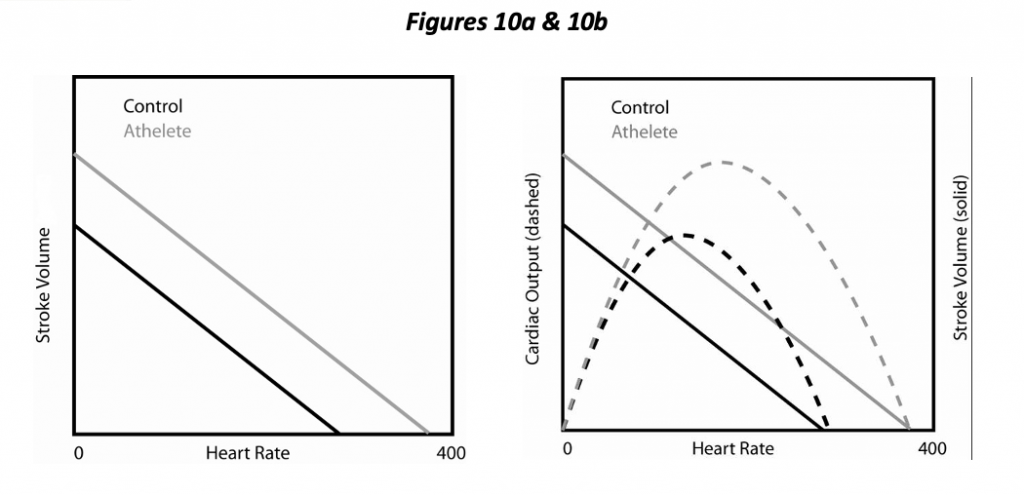
Cardiac output (CO) equals stroke volume times heart rate. A trained individual may readily increase heart rate by 2 ½ times in the course of exercise (more for horses!). Consequently, heart rate is a major determinant both of cardiac output and myocardial oxygen requirement. Not so obvious is that heart rate has an effect on the other determinants. Increasing HR by pacing the heart decreases SV under experimental circumstances (Figure 10a) and also decreases the diastolic interval relative to the systolic (i.e., a more rapid heart rate mostly decreases the diastolic interval, not systolic). In essence, increasing heart rate decreases preload due to decreased filling time. The interplay between HR and SV results in the occurrence of an optimal HR, one that maximizes cardiac output (Figure 10b). With further increases in heart rate beyond this point, decreasing SV overrides the increasing heart rate, and cardiac output diminishes. (One functional aspect of a trained athlete is a higher optimal HR; CO continues to increase with HR to a greater extent). Increasing HR also increases contractility a little bit by increasing calcium availability, the so-called force-frequency relationship.
Synergy of contraction has to do with synchronization and coordination of the heart as a pump, and there is more than one aspect to this. First, there is the relationship between atrial and ventricular contraction (AV synchrony). Normally the atrium contracts just prior to ventricular contraction and contributes to optimal preload of the ventricle. Loss of this “atrial kick” may result in an almost 25% decrease in stroke volume; in a compromised individual, this can mean the difference between compensated and decompensated (i.e., heart failure) function. Intra- ventricular synchrony is another aspect of synergy of contraction. The Purkinje system functions to convey the cardiac activation impulse rapidly through the ventricles so that myocyte contraction occurs in unison. Imagine what would happen if only part of the ventricle were activated at a time! Examples of this phenomenon include bundle branch block and ventricular ectopic beats where the activation sequence of the heart is disturbed and a loss of the efficiency may occur.
II. Cardiovascular Reserves
The overall cardiovascular reserve is a measure of the ability of the cardiovascular system to deliver oxygen to the tissues. Oxygen delivery depends upon both blood flow and oxygen extraction. Therefore, the overall cardiovascular reserve can be represented by the product of cardiac output and arteriovenous oxygen difference. Maximum oxygen delivery to tissues depends on four principal components of the cardiovascular reserve: the venous oxygen reserve, the maximum cardiac output that can be sustained, the efficiency of myocardial energy release, and the oxygen delivery to the myocardium. Depleting any one of these components diminishes the total reserve and affects all other reserve factors.
Exercise taxes the ability
of the cardiovascular system to convey blood to the peripheral tissues, and as such, exercise
requires large scale cardiovascular adaptations. In all mammals that have been studied, cardiac output
during exertion is directly related to oxygen consumption. The oxygen content of arterial blood is
normally in the range of 200 mL per liter of blood. The oxygen content in venous blood (mixed venous from all
tissues) is about 150 mL per liter of blood.
There is, therefore, normally a large venous oxygen reserve
— and this is represented
by the oxygen content in the venous blood. Oxygen
delivery could be increased by a combination of increased total blood flow (an
increased cardiac output) as well as
by more complete oxygen extraction from each increment of blood flowing through
the tissues. During exercise, the
cardiac output normally increases and the oxygen content of venous blood drops
to a much lower level in many tissues. Oxygen
extraction is therefore increased. Increased
oxygen
utilization during exercise in muscle is achieved by increasing cardiac output, redistributing blood flow from inactive to active tissue, increasing oxygen extraction from the blood, and incurring an oxygen debt (i.e., anaerobic metabolism) if necessary.
The cardiovascular reserves available to the normal animal depend upon the ability to increase cardiac output above the resting level and the ability of the tissues to extract more of the oxygen presented to them. If the individual had insufficient cardiac output at rest, it would be expected that their venous blood O2 content would be reduced. Similarly, the individual with heart disease frequently cannot increase their cardiac output to the extent the normal heart can, and therefore their maximum utilizable cardiovascular reserves are reduced.
The cardiac reserve then consists of the stroke volume reserve and the heart rate reserve. Increases in heart rate can be effective in increasing the cardiac output up to approximately two and a half times the resting heart rate for that particular animal. If the heart rate is already increased at rest, part of the “heart rate reserve” is also being used at rest. The stroke volume reserve is used if the heart fills more completely “using the diastolic reserve volume,” or ejects more completely “using the systolic reserve volume.” With moderate exercise, the increase in cardiac output is due primarily to the increase in heart rate — with severe exercise, the rise in stroke volume may represent an increase of up to two and a half times over the control value (well trained athletes).
In some forms of heart disease, the increase in cardiac output with exertion is due more to an increase in stroke volume than an increase in heart rate. These patients include those whose increase in heart rate is limited during exertion (they have heart block). Training tends to decrease the heart rate at rest, and athletes of any species tend to display much less tachycardia during a given level of exertion than do untrained individuals given the same conditions. Oxygen extraction increases progressively with greater workloads, and at maximum levels some 75% of the oxygen is removed from the blood passing through the systemic capillaries. Training also seems to increase the ability of the muscle to extract more oxygen.
The efficiency of ventricular energy release can be calculated by knowing the oxygen consumption of the myocardium and coronary blood flow and the useful work of the left ventricle. The efficiency of the normal left ventricle may improve during exercise when the increase in its useful work is more than the increase in myocardial oxygen consumption.
Patients with heart failure frequently demonstrate a reduced efficiency at rest which declines even further during exercise! The oxygen delivery to the myocardium depends upon the same factors which determine oxygen delivery to other tissues of the body — the blood flow and the average quantity of oxygen removed from each increment of blood. The oxygen extraction from coronary blood is so great that little oxygen remains after the blood passes through the capillaries (there is little venous oxygen reserve in the coronary circulation). Therefore, the principal mechanism for increasing oxygen delivery to the heart is increased coronary blood flow. Blood flow is increased largely by coronary vasodilatation — increasing the diameter of the coronary vessels. If their diameter is narrowed (as with arteriosclerosis or atherosclerosis), there is obviously a diminished coronary vascular reserve. Diseases requiring an increased oxygen delivery at rest (as with tachycardia, increased wall tension, myocardial hypertrophy) also “use up” the coronary vascular reserve, thus limiting the amount that can be called upon to meet any increased demand.
III. Functional Response to Heart Disease
Now that you understand the normal physiology of the cardiovascular system, we will begin to consider how the system adapts under disease conditions. First, it must be said that the elastance model described is primarily applicable for understanding acute changes in cardiovascular function, i.e., ones occurring within a specific heart over a short period of time, such as what might be brought about by a drug or volume infusion, exercise, or other short term adaptations. However, these loops can also illustrate long-term changes resulting from various disease processes after the heart actually changes its intrinsic structure, also called remodeling. These include the autonomic nervous system and a range of neurohormonal mechanisms for short term adaptations resulting in an integrated response. Modulation of the sympathetic nervous system (SNS) allows for nearly instantaneous changes in system function. Responses of the CV system to augmented SNS stimulation include increased heart rate, increased contractility (invokes systolic volume reserve), arteriolar vasoconstriction (increases blood pressure at a given cardiac output but invoked to maintain blood pressure at reduced cardiac output in cardiac disease), and venous vasoconstriction (increases preload, invokes diastolic volume reserve). Neurohumoral factors released into the circulation may include norepinephrine, epinephrine, angiotensin, and arginine vasopressin. Each of these have multiple effects that tend to result in short term vasoconstriction and increased heart rate, and long term effects of fluid retention and CV system remodeling. Retention of body fluid serves to increase cardiac preload (invokes diastolic volume reserve), and through remodeling, the circulatory system attempts to “outgrow” the deleterious circumstances. Unfortunately, it is a system not well-suited to this mode of adaptation. Within a few weeks of birth, cardiomyocytes can no longer enter the cell division cycle (hyperplasia). The heart can hypertrophy, however, resulting in increased myocardial tissue in the form of additional contractile proteins (sarcomeres). Concurrently, there may be important changes (remodeling) of the supportive interstitial tissue and extracellular matrix. Another result of activation of remodeling pathways may be loss of myocardial cells through apoptosis (cell death), or autophagy (programmed self-degradation process for the purpose of materials recycling).
Cardiac hypertrophy is defined simply as an increase in myocardial mass. It occurs with most types of heart disease, and two major patterns or categories are evident: concentric versus eccentric hypertrophy. Concentric hypertrophy is characterized by an increased relative wall thickness in diastole; typically the heart wall thickness actually increases and the chamber dimension (radius or diameter) actually decreases. Concentric hypertrophy occurs most typically as a result of a primary disease of the myocardium called hypertrophic cardiomyopathy (HCM), or secondary to various causes of pressure overload affecting either the right ventricle (pulmonic stenosis or pulmonary hypertension), or left ventricle (aortic stenosis or systemic hypertension). Pressure overload exposes the myocytes to excessive mechanical stress during systole and invokes a complex biochemical cascade involving protein kinases.
Additional sarcomeres are produced in parallel with each other, concurrent with thickening of individual myocytes, and additional production of intracellular microtubules and fibroplasia of the interstitial tissue. Growth of the myocardial tissue in this way has the effect of returning mechanical wall stress towards normal (LaPlace relationship).
Eccentric
hypertrophy is characterized by dilation
and hypertrophy. While myocardial
tissue mass is increased by definition, relative wall thickness is normal or,
more typically, decreased (chamber diameter is increased and wall thickness is
normal or decreased). Eccentric
hypertrophy typically results from primary myocardial disease (dilated
cardiomyopathy or DCM) or from conditions resulting in volume overload of the right ventricle (tricuspid insufficiency,
pulmonic insufficiency, atrial septal defect), left ventricle (mitral
insufficiency, aortic insufficiency, patent ductus arteriosus, ventricular septal defect),
or both ventricles (e.g., anemia). (While
these are all examples of eccentric hypertrophy, DCM is NOT an example of
volume overload. The DCM heart has
decreased stroke volume; volume overload implies
increased stroke volume in its definition.) This type of hypertrophy is consequent, in part, to mechanical stresses resulting from chronically increased preload (as opposed to increased afterload in the case of pressure overload hypertrophy). The extracellular matrix remodels to allow the chamber to expand, i.e., dilate to accept greater volume in response to higher filling pressure. However, the resulting change in relative wall thickness also necessitates an increase in systolic wall stress (LaPlace). Once again the myocytes hypertrophy, but sarcomeres are added in series with each other. The myocytes necessarily become longer and/or rearrange so that the larger chamber circumference is still enclosed by the same number of myocytes.
The cardiovascular reserves are employed by the body to maintain requirements for blood flow and blood pressure. With mild cardiac dysfunction, the system is able to compensate, maintaining normal cardiac output and blood pressure with minimal incorporation of the reserves. The individual shows no outward signs of cardiovascular disease, although dysfunction may be detected by physical examination (heart murmur, increased heart rate, etc.) or special examination (e.g., echocardiogram). The animal may no longer be able to engage in the maximal extent of activity, but quality-of-life may remain good to normal. With worsening dysfunction, adequate cardiac output no longer occurs without excessive incorporation of adaptive mechanisms; the most common result is congestive heart failure in which clinical signs due to fluid retention become increasingly evident. At the same time, vasoconstriction and increased vascular impedance are present so that blood pressure is maintained in the face of diminishing cardiac output. The vasoconstriction is selective, i.e., predominating in “nonessential” vascular beds (muscle, splanchnic, cutaneous); with persistence and severity, these vascular beds actually remodel and atrophy themselves.
Decreased exercise tolerance is not entirely due to impaired cardiac output but is contributed to by the loss of vascular supply. In the worst case, the system is no longer even able to maintain blood pressure with available cardiac output. The resulting hypotensive condition is known as cardiogenic shock and is grave unless the underlying cause can be reversed.