Introduction, Overview, and Review
John E. Rush, DVM, MS, DACVIM (Cardiology), DACVECC
Cummings School of Veterinary Medicine at Tufts University
Last Updated 12/05/2020
Volume has physical units of length cubed; e.g. 1 mL = 1 cm3 and 1 L = 1000 cm3. The volume of an animal increases proportionally with its weight and the mass of blood within the circulation is roughly 7-8% of the total mass. Hence the blood volume of a 20 kg dog has a mass of about 1.5 kg (20kg x 0.075) and occupies a volume of 1.5 L since blood density is quite near that of water (1 kg/L).
The majority of blood volume in the systemic circulation (75-80 % of the total) resides within the veins which serve as the main blood reservoir for the cardiovascular system. A relatively small fraction (~ 5%) of blood volume is within the microcirculation, i.e. capillaries and small vessels less than 100 µm in diameter.
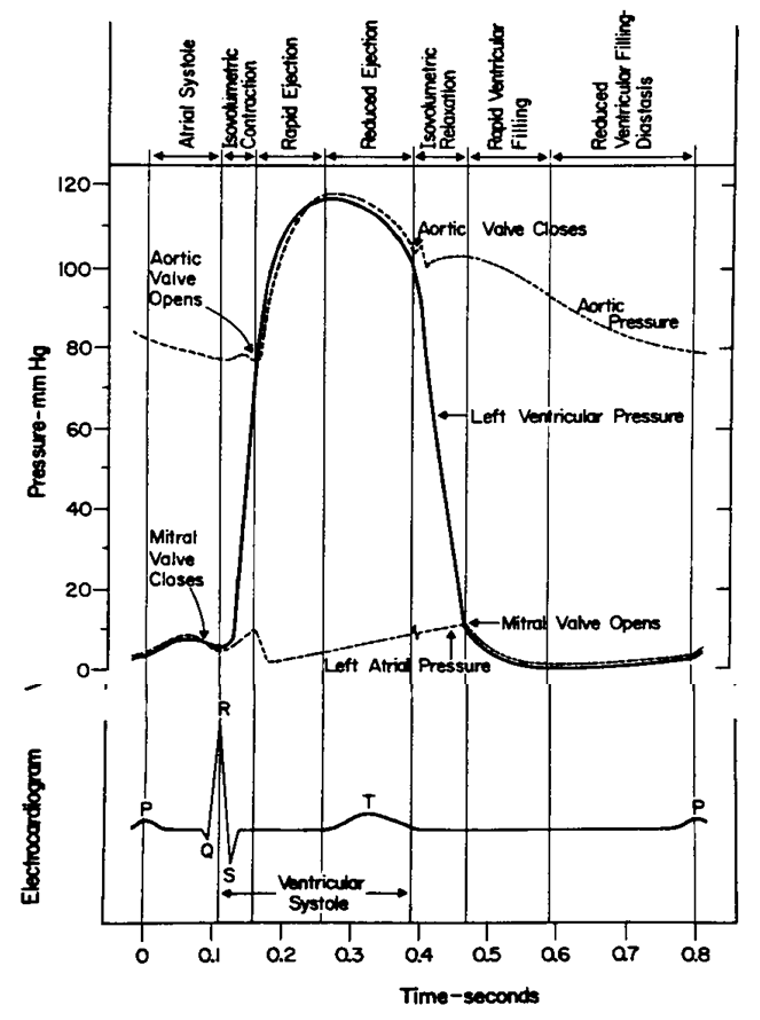
Contraction of the normal cardiac ventricles results in ejection of most (but not all) of the blood volume from the ventricles (e.g. ~60%) into the great vessels; the left ventricle ejects into the aorta and the right ventricle into the main pulmonary artery. Mechanical contraction is preceded by electrical activation (evident from the electrocardiogram) which initiates intracellular calcium release that triggers muscular contraction. Maximal volume of the ventricles occurs just before initiation of contraction at end diastole corresponding to the start of the QRS complex of the electrocardiogram. Hence the cardiac volume at this moment is referred to as the end diastolic volume and is abbreviated EDV. At the end of ventricular systole, i.e. when the aortic and pulmonic valves close, cardiac volume attains a minimum (end systolic volume or ESV). The fraction of blood that is ejected from the ventricle is known as the ejection fraction (EF); this quantity is a useful clinical index of cardiac systolic function and is calculated from measured EDV and ESV as follows:
EF = (EDV-ESV)/EDV x 100% = SV/EDV x 100%
The stroke volume (SV) is the amount of blood ejected by the ventricle and is equal to EDV-ESV.
Pressure has physical units of force per unit of the area; force that is normalized for size in this way comes upso frequently that it has been given its own name, mechanical stress (force/area). In physiology and cardiovascular medicine, units of stress are almost universally converted to the height of an equivalent column of mercury subjected to the force of gravity on earth. This conversion is possible because of the relationship:
P = ρ g h
This is the “static” portion of Bernoulli’s equation where P is pressure, ρ is the density of mercury (13.6 g/cm3or 1.36 g/cm2-mm), g is the acceleration of gravity (980 cm/sec2 on earth) and h is the height of the mercury column (e.g. mm). Since ρ is particular to mercury and g is constant on this planet, P is uniquely related tothe height of the liquid column. Occasionally cardiovascular pressures are measured in terms of cm of a column of water and this may allow you to get a handle on the physical quantities involved. A typical arterial pressure is roughly 100 mmHg which also corresponds to a 136 cm water column. If you were to poke a hole in an artery (or left ventricle of the heart), the jetting blood would squirt to a height of 1.36 meters above the level of the hole! (Don’t try this at home!)
Pressure in the ventricles and arterial circulation, and to a lesser extent the microcirculation, is pulsatile; it oscillates significantly with each cardiac ejection above and below a mean (average) value. The degree and shape of the pressure oscillations vary within the circulation, with the magnitude of the oscillations actually increasing distally from the heart to the level of the large systemic arteries, then pulsations diminish through the microcirculation and are virtually absent in the systemic veins.
Throughout the course we will refer to the contracting, ejecting stage of the cardiac cycle as systole in the relaxing, filling stage as diastole. (The precise definition of each phase may vary to suit the purpose.) Hence the peak (maximal) pressure in an artery is referred to as systolic pressure and the minimum as diastolic pressure. The difference between the two is known as pulse pressure; it is this variation in pressure that your fingers are sensitive to when feeling the patient’s pulse. When we express blood pressure in a report we often write or say the systolic value “over” the diastolic value; no mathematical division is implied in this convention.
We also need the concept of (time) averaged pressure and this is not the simple average of the systolic and diastolic values because the pulsating pressure spends more time near the diastolic value. The strict definition of mean pressure results from averaging all of the pressures that occur over a cardiac cycle and entails a mathematical integration to determine the area under the pressure curve. In clinical practice, the mean arterial pressure can be approximated as the diastolic pressure plus one third of the pulse pressure:
P mean ~ P diastole + (P systole – P diastole)/3
As alluded to above, pressure is a normalized force and acts on blood and all cardiovascular structures according to Newton’s laws of motion. Mean pressure within the circulation is greater upstream (proximally) than downstream (distally) and this difference constitutes a driving pressure. Average blood flow is driven by average driving pressure. Pressure is also greater within the circulation than outside; this difference constitutes the distending pressure (The external pressure on some circulatory structures is often near atmospheric, i.e. “0”, so that the internal pressure may be regarded as the distending pressure.) The distending pressure also serves to drive fluid (plasma) within the circulation through the wall of the vessel; whether it may do so depends on how permeable the vessel wall is to this flow.
Please try to commit to memory the normal pressures of the cardiovascular system and also the features ofthe normal cardiac cycle (Wiggers diagram, below). Normal clinical values vary among species but approximate concepts will be necessary for your understanding of cardiovascular pathophysiology.
Approximate cardiovascular pressures
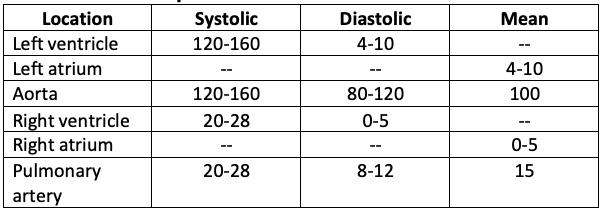
While on the subject of pressure, is worth pointing out a couple of important features of this table. Notice thatthere is no “significant” pressure difference across a normal open valve (compare systolic values for the left ventricle and aorta for example). Secondly, students are sometimes disinterested by the diastolic pressure values of the ventricles which are simply “low”. These pressures are critical in normal cardiovascular function!! A decrease of the few millimeters of mercury results in shock whereas an increase of a few will define the condition of congestion. Elevation of the pressures in the aorta and the pulmonary artery are synonymous with systemic hypertension and pulmonary hypertension respectively.
Materials of all sorts, steel or biological, liquid or solid, deform or yield in response to mechanical stresswhere stress is force that has been normalized by surface area. It isn’t force per se that determines whether a material will distend or break because the latter depends on how much material is there to resist the force. Similarly, it isn’t so important how much force a muscle has to generate unless we also consider how much “beef” is available to throw at the problem.
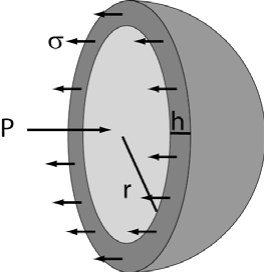
Consider a spherical vessel, as we often do, that is subjected to an internal (distending) pressure, denoted by P. This pressure exerts a force on each half of the sphere equal to the pressure (force per unit area) multiplied by the area it acts upon, i.e. the internal cross- sectional area of the sphere or π r2 in this case where r is the radius of the sphere. You can see from this simple equation that the larger the sphere, the greater the force acting to distend the vessel. The opposing force must be equal and opposite (unless the sphere explodes) and is equal to the mechanical stress in the material, σ, multiplied by the area it acts upon; for a sufficiently thin-walled sphere, this area can be approximated as a long skinny rectangle of length 2 π r (perimeter of a circle) and height h. Since the forces are equal and opposite, we have:
P π r2 = σ 2 π r h
σ = P r / (2 h)
This is the famous LaPlace relationship which says that the stress in the vessel wall (e.g. heart wall) is proportional to the distending pressure and also the ratio, r/h. The tremendous implication is that an increase in chamber dimension without a proportional increase in wall thickness results in increased mechanical stress in the wall. For the heart, this mechanical stress is force that the muscle has to generate during contraction and comes at a great expense in terms of energy and myocardial oxygen requirements.You can think of σ as being most closely related to the force that has to be generated by individual sarcomeres of the muscle. (Note: the mature heart has a fixed number of myocytes but may greatly increaseits mass, number of sarcomeres.) We will see that the heart normally responds to an increase in σ by hypertrophying, a process that tends to preserve the r/h ratio and maintain mechanical stress within biological tolerance levels.
When the heart must eject against a greater pressure than normal, we refer to this as a pressure overload and can often recognize the condition from the hypertrophic response (decreased r/h, or increased h/r). Cardiovascular pressures are similar across a wide range of mammalian species of extremely varying body size; i.e. pressure is not proportional to body size. Similarly, the r/h ratio (but not heart size) is preserved over an extremely wide range of body size so that myocardial sarcomeres generate similar forces, irrespective of the animal size or species.
Flow rate of blood has physical units of volume/time, e.g. L/min or mL/sec. The (time) averaged rate of total blood flow generated by the heart is known as the cardiac output (CO) and it is another useful clinical measure of cardiac function. As you might imagine, the normal CO depends on the size of the animal inquestion as well as the demand for nutrients and oxygen resulting from tissue requirements. I.e. fortunately for you, CO increases with exercise. A rule of thumb for estimating the normal resting CO for a wide range of animal size and species is about 100 mL/kg/min. An invaluable relationship for you to remember is that the cardiac output is equal to the stroke volume multiplied by the number of strokes per minute, i.e. the heart rate.
CO = SV x HR (remember this)
Like pressure, flow rate is actually pulsatile within the arterial system and varies dramatically over the cardiac cycle.
The right and left hearts are normally arranged in series with each other such that their cardiac outputs arethe same over any appreciable length of time. The necessity of this condition can be evaluated by considering the alternative; suppose the CO of the left ventricle (LV) were slightly less than that of the right ventricle (RV). In this situation the RV would pump more blood into the pulmonary circulation than the LV pumped out of it and the lungs would explode within a predictably short period of time! Now it so happens that we will consider pathological situations in this course in which the cardiac outputs of the two ventricles are not equal. This occurs under the circumstance of a shunt where the entire CO of one ventricle is not necessarily delivered to the other — in other words the two ventricles are no longer strictly in parallel anymore. Hence, we must modify the earlier statement of equality for the CO of the left and right hearts and say that the effective cardiac output is the same for both.
Velocity of the blood or heart has the same units as any other velocity, length/time, and m/sec or cm/sec are typical units used. Blood velocities in the circulation are greatest near the heart and diminish peripherally to the level of the microcirculation where the blood crawls along at < 1mm/sec. This arrangement is due to the vast increase in vascular cross-sectional area proceeding from the heart to the microcirculation, and facilitates diffusion of gases and nutrients at the capillary level.
Blood velocities are not particularly body size dependent and normal values between breeds and species ofwidely differing size are nearly interchangeable. We shall see that near the heart (where resistance to blood flow is very low), velocities are governed by a different part of Bernoulli’s equation that relates a change in pressure to a change in blood velocity, i.e. an acceleration.
∆P ~ ∆ ρV2/2
A pressure difference between one location and another results in a predictable acceleration of the blood to anew velocity. Hence similar pressure values for the chambers of the heart (see above) results in similar accelerations and blood velocities that are relatively size and species independent.
Resistance as the name implies, is a physical property that resists blood flow through a vessel. It is denoted in terms of the driving pressure required to result in a given amount of flow and consequently has units of pressure/flow. (mmHg)/(L/min) are, for example, valid units for resistance and the numerical value for a particular vessel could be obtained by dividing measured driving pressure (upstream minus downstream pressure) divided by the concurrent flow rate. This is in fact how we determine the total peripheral resistance (TPR) which is the resistance of the entire systemic circulation.
TPR = (MAP – RAP)/CO
Here MAP stands for mean aortic pressure, RAP for right atrial pressure, and CO for cardiac output as before. Notice then that a greater driving pressure for a given cardiac output implies greater TPR and that increased cardiac output for the same driving pressure implies decreased TPR. Furthermore the equation isreadily rearranged as follows:
MAP = TPR x CO (+RAP)
This equation states that the body has two primary mechanisms by which it can control mean arterial pressure; either increase cardiac output or total peripheral resistance. (RAP effect on this equation is usually minor when you consider the normal values.)
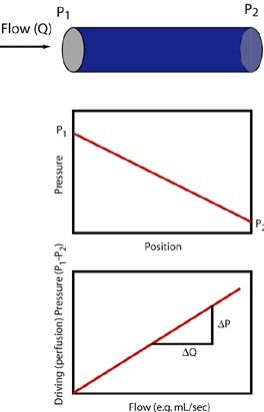
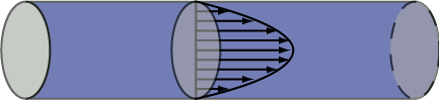
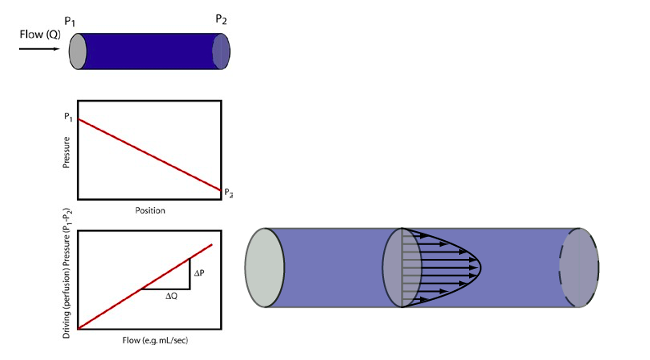
Resistance has to do specifically with pressure “lost” due to friction and is consequently associated with yet another part of the Bernoulli equation. When steady (non pulsatile) liquid flow occurs in a cylindrical tube, the liquid particles take on a specific parabolic velocity profile with the fastest particles at the very center of the tube and the slowest actually stopped at the walls. Pressure diminishes steadily, proceeding from theupstream to downstream end of the tube, associated with energy loss due to friction. The faster the fluid flows, i.e. greater flow rate, the greater is this pressure loss. Resistance (R) is the proportionality constant between these two (∆P and flow rate).
In this circumstance known as Poiseuille flow, the pressure force exerted on each fluid element is exactly opposed by the frictional force resulting from the fluid elements sliding against each other. For the Poiseuille situation, we can calculate the resistance without having to make actual measurements of pressure and flow as shown in the equation. Resistance increases proportionally with the length of the tube (longer tube >greater resistance) and the viscosity (µ) of the liquid. The latter has to do with how much friction is generated when fluid layers slide against each other. Honey and motor oil, for example, are very viscous fluids compared to water; blood is about 3-4 times as viscous as water (hence the old adage “ blood is thicker than water”). However, the primary means by which resistance may be modified in the body is to adjust the vascular radii through vasoconstriction or vasorelaxation (collectively vasomotion). As the equation shows, increasing the radius decreases resistance dramatically, i.e. proportionally to the fourth power of the radius. Decreasing the vessel radius by a factor of 2, for example, increases the resistance by a factor of 16!
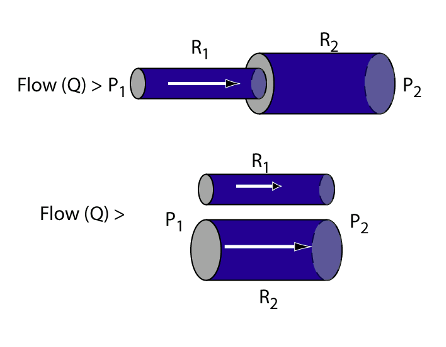 Blood vessels in vascular systems (resistances) may be arranged in series, such that all flow must pass through both resistances, or they may be arranged in parallel so that blood flow has a “choice”. Arranged in series, the flow through both resistances is the same but the driving pressure is the sum of driving pressures for both resistances. Consequently resistances arranged in series increases totalresistance of the combined resistances. Resistances added in parallel, however, results in more flow for the same driving pressure; the combined resistance is less than either one of the original elements.
The systemic and pulmonary circulations are arranged in series as described above; all blood flow pumped through the systemic circulation returns to the RA where it is subsequently pumped through the lungs in its entirety. The fact that all blood flow must pass through the lungs turns out to be a valuable relationship from a number of standpoints. First of all, it is all subjected to gas exchange, limited by the capacity of the lungs. Secondly, the capillary bed of the lung filters all particulate material from the circulation substantially greater than red blood cell size. Different from the pulmonary circulation, the systemic includes circulations in parallel such that blood flow can be diverted away from one circulation (renal for example) in favor of an alternate route that is physiologically preferred under the circumstances (muscles, heart, brain, viscera, etc.).
You may be rather adept yourself in taking the “path of least resistance”, but flow through parallel circulations does so in a well prescribed way. If two circulations are in parallel, R1 and R2 for example, then the fraction of flow through the R1 resistance is R2/( R1 + R2). Consequently, the greater the resistance of one pathway relative to the alternate pathway, the more flow will go to the alternate (lower resistance) pathway.
While each and every blood vessel has its own resistance in the circulation, resistance of the circulation at large resides primarily in the microcirculation, particularly the arterioles, such that vasomotion of the large arteries and veins has minimal effect on TPR. This is due, of course, to the large radii of these vessels.Consequently distribution of blood flow to systemic organ beds derives from relative microcirculatory vasomotion in these beds and has little to do with vascular smooth muscle of the large arteries and veins. TPR, however, has an important effect on blood pressure as shown earlier in conjunction with cardiac output. The body maintains blood pressure by adjusting CO and TPR where the latter is the resistance of the entire systemic circulation; blood pressure is increased by vasoconstriction. However, blood flow is diverted to a specific organ bed by adjusting the relative resistances of parallel beds. Blood flow to a specific bed is increased by vasodilation to that bed. Students sometimes find this paradoxical if they don’t think it through since vasoconstriction increases blood pressure, thereby maintaining available driving pressure for all beds, but also decreases flow to the vasoconstriction beds.
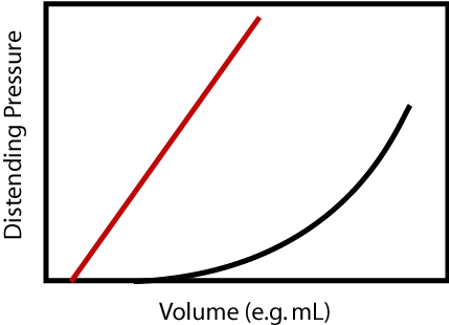
Resistance was a relationship between driving pressure and flow. Compliance is a relationship between distending pressure and volume. In loose terms, a more compliant vessel holds more volume at a given distending pressure. If you want to get technical, as is sometimes required in cardiology, compliance is defined as the rate of change of volume with respect to pressure, dV/dP. So a compliant vessel changes its volume a lot for a small change in pressure. The reciprocal of compliance, dP/dV, is known as the chamber stiffness or sometimes the elastance; obviously a vessel with higher compliance has lower elastance or chamber stiffness.
Just as resistance has the effect of determining the distribution of blood flow, compliance of one vessel relative to another determines the distribution of blood volume. We can consider to vessels that are in communication with each other, i.e. blood will flow between the two of them, and begin adding volume to both. Since the internal and external pressure (distending pressure) is the same for both, more volume will be added to the more compliant vessel.
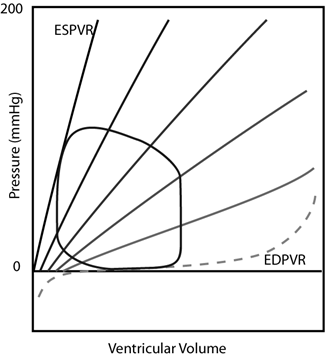
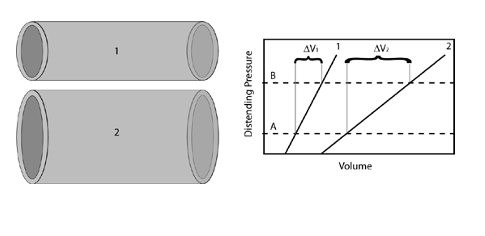 There are two complicating issues to this concept for the cardiovascular system. First compliance curves are not typically the straight-line relationships shown in the above figure, but curves such that compliance decreases with increasing volume; the chamber becomes stiffer as volume is added. Therefore while the compliance concepts given above still hold, we will sometimes refer to a “compliance curve” of a particular vessel as its pressure-volume relationship (PVR), implying that this relationship may not be a straight-line, but knowing either the distending pressure or chamber volume immediately determines the other through thePVR.
The second issue is that the body adjusts compliance through vasomotion, just as it adjusts vascular resistance. PVR curves are not fixed but rather compliance decreases (stiffness or elastance increases) with muscle contraction. This compliance adjustment can occur “slowly”, as in the case of vascular smooth muscle contraction, or “quickly” as in the case of myocardial contraction.
Within the circulation, it is the large veins and the heart itself that possess the greatest compliance. Therefore most of the blood resides in these vessels and vasomotion of the veins can affect compliance ofthe entire circulation dramatically such that venous contraction results in elevation of blood pressure throughout the circulation and redistribution of blood volume into other compliant structures. Where does this blood volume go? Importantly, into the next most compliant structure — the heart! Venous constriction causes increased diastolic filling pressure and volume of the diastolic heart in accordance with the heart’s PVRs (a different PVR for each chamber of the heart).
Having discussed compliance in this way allows for a succinct yet fairly comprehensive statement of themechanics of cardiac function. With each contraction, the chambers of the heart cycle their compliances (PVRs) being maximally compliant during diastole and maximally stiff (incompliant) during systole. During diastole, blood volume is redistributed into the compliant chambers of the heart from the venous circulation. During systole, blood volume is redistributed out of the chambers into the arterial circulation. It is the valves of the heart primarily that enforce the unidirectional flow. Adequate cardiac function is dependent upon its chambers’ ability to become appropriately compliant during diastole (“diastolic function”), stiff during systole (“systolic function”), and to cycle between these states in a “timely” fashion. The actual values for “how compliant”, “how stiff”, and “how fast” are dependent on the size of the animal and the immediate level of activity.
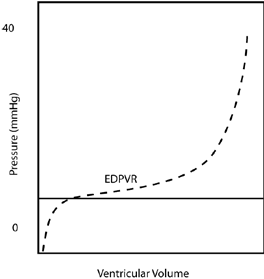
Preload is a term that was defined originally for individual strips of muscle in a bench-top physiological experiment; it was the initial force or stretch applied to the muscle strip causing the muscle to lengthen, thereby affecting sarcomeric length and function. This is also referred to as heterometric autoregulation of the muscle function referring to functional changes that occur due to “differing lengths”(heterometric) of the sarcomeres. In whole heart and clinical terminology, preload is the end diastolic pressure (EDP) or the end diastolic volume (EDV); while there are arguments as to which is the preferred definition, these two are directly related through the end diastolic PVR (EDPVR). In any case, these more practical definitions of preload are surrogates for sarcomeric length (SL) and mechanical stress (σ), the latter being force normalized for complex cardiac geometry. The importance of the preload concept derives from the Frank-Starling Law of the heart which is that increasing preload within an individual heart results in increased stroke volume and cardiac output. This is a fundamental concept in cardiology and one that must never be forgotten throughout your career as a veterinarian.
The physiological basis for heterometric autoregulation is now thought to reside primarily in modulation of calcium availability, and sensitivity of the contractile proteins to this calcium, that is somehow coupled to sarcomeric length. The mechanism by which this occurs is not known.
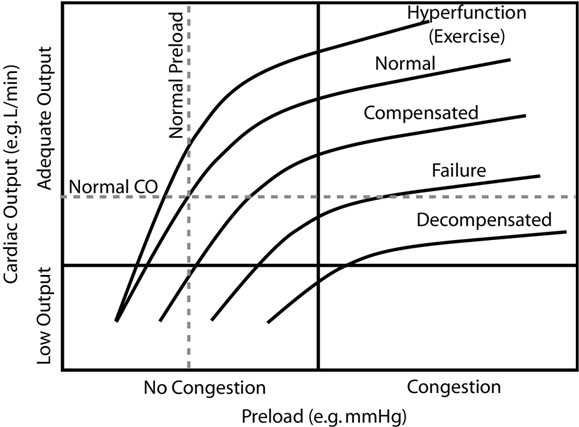
The stylized figure below depicts the effect of preload on cardiac output (Frank-Starling Law) at different levels of cardiac dysfunction. (We will revisit these curves for various purposes — it would be well for you to understand it thoroughly.) This is a variation on the so-called Guyton curve named after a prominent cardiovascular physiologist. Considering only the “Normal” curve, we see that increasing preload (filling pressure, i.e. EDP) results in increased cardiac output. The normal heart is very sensitive to preload and changes cardiac output dramatically with small changes in preload. Notice that modest preload reduction in the normal heart readily decreases cardiac output into the “Low Output” zone. You will wear protective gloves when applying nitroglycerin paste (preload reducing agent) to your patients’ skin lest you experience a personal low output event (as viewed from the floor). We say that the normal heart is “preload dependent” because of the marked effect on cardiac output produced by small changes in preload.
As an aside, note that equal cardiac output for the two hearts is maintained through the Frank Starling mechanism. If the right heart were to pump more blood than the left for a short period of time (it typically does this during inspiration), then the volume of blood entering the pulmonary circulation will increase at the expense of systemic circulation volume. Consequently the preload of the left ventricle will increase and the right will decrease. This will shift the stroke volumes of the ventricles back to equality through the Frank Starling mechanism.
Afterload also was defined originally from physiological experiments performed on muscle strips; it is the force produced or load lifted by the muscle strip after stimulated to contract. In the whole heart or clinical circumstance this translates to the pressure against which the heart contracts, once again a surrogate for mechanical stress (σ) that is difficult/impossible to obtain. This is only one definition of afterload and has the disadvantage of being dependent on the state of the heart since the heart itself generates the pressure that it contracts against. Others advocate for vascular impedance as the best practical description of afterload which does not depend on the state of the heart. Due to its complexity, we will not define vascular impedance here but state that it includes not only the resistance (TPR) of the circulation but also compliant and inertial properties. However, impedance is not an applicable definition of afterload in all circumstances whereas pressure and mechanical stress are.

As depicted stylistically on the above chart, increasing afterload results in decreased stroke volume (and cardiac output if heart rate is held constant). The normal heart, however, is relatively “afterload independent”; stroke volume doesn’t change drastically with increasing afterload under normal circumstances. However with increasing cardiac dysfunction, worsening contractility and systolic dysfunction specifically, the heart becomes “afterload dependent” where relatively small increases in afterload lead to drastic reduction of cardiac output.
Contractility is the ability of the myocardial tissue to shorten against a force or load, independent of changes in preload or afterload. It turns out this is a very difficult quantity to define in a way that makes everyone happy and numerous physiologists have spent their careers attempting to do so. This is partly due to the fact that there is more than one aspect to muscular contraction, i.e. the rate of contraction, which is related to the biochemical machinery which hydrolyzes ATP (myosin ATPase), and separately the extent and force of contraction, relating primarily to the numbers of active actin-myosin binding sites. Force/extent of contraction is closely tied to the availability of calcium at the sarcomere, which binds to the troponin-C molecule (TPN-C)of the sarcomere and disinhibits the actin-myosin interaction, and also the calcium sensitivity of TPN-C, i.e.affinity for calcium. Additionally, different myosin isomers have differing ATPase activity (relating to the velocity of contraction). As stated earlier, the definition of contractility was intended originally to be independent of preload in afterload affects. However recent evidence suggests that the effect of preload onthe force of contraction (heterometric autoregulation) is probably linked to calcium availability and sensitivity, i.e. the same mechanism as changes in contractility (homeometric autoregulation).
While difficult to define and express physical units, it is often possible to recognize a change in contractility when you see it. In the Guyton curves above (CO against preload), differing levels of contractility are expressed by each curve. Depressed contractility is evidenced by decreased cardiac output at any particular preload compared to the normal curve (afterload held constant). Alternatively, preload must increase in order to maintain normal stroke volume in a heart with depressed contractility. The subsequent chart (SV against afterload) depicts the afterload dependence associated with depressed contractility.
Cardiovascular Diseases
Cardiovascular diseases can be considered broadly in terms of the anatomic locations and etiologic agents that may cause disease. The heart consists of myocardial tissue, four valves, two atria and two ventricles (left and right for each), a coronary vascular system, pericardium, and a conduction system to initiate and convey the electrical activation. The vasculature consists of arteries, veins, microcirculation, and lymphatic ducts. Functional valvular disease results primarily in one of two problems (or both): either the valve leaks when it is supposed to be closed (valvular insufficiency or valvular “regurgitation”), and/or it obstructs blood flow when it is supposed to be open (valvular stenosis). Each of these valvular abnormalities subjects theheart to abnormal loading conditions. A leaking valve requires the heart to generate additional stroke volume (volume overload) whereas a stenotic valve may require the heart to generate additional pressure to force the blood through the diseased orifice (pulmonary stenosis, aortic stenosis). Myocardial diseases may result in systolic dysfunction (i.e. failure to contract with adequate force, extent, or rate) and/or diastolic dysfunction (failure to relax fast enough or to an adequate extent). The pericardium surrounding the heart may become incompliant/ undistensible (constrictive pericardial disease), which has a similar effect as myocardial diastolic dysfunction, or the pericardial space can become filled with fluid (pericardial effusion) with similar effect. Although uncommon in veterinary patients, the coronary vasculature can become obstructed resulting in ischemic heart disease, the leading cause of death in human beings. Any of these abnormalities, if drastic enough, can result in the syndrome of congestive heart failure, which is a condition resulting in pronounced morbidity and mortality.
The General Transport Concept
The heart and circulation deliver a wide range of nutrients, gases, hormones, etc. within the vastly complex blood milieu. In this review we will briefly consider the general transport concept that applies to each and every of these chemical species. Considering one of the most important, i.e. oxygen, we may indicate the rate at which the heart delivers oxygen to the body as the blood flow rate multiplied by the concentration of oxygen within the blood.
Oxygen delivery rate = CO x [O2] arterial
The arterial oxygen concentration depends in turn upon the amount of hemoglobin in the blood and its level of saturation, but there’s no need to complicate the concept with this detail for our purposes. The body doesn’t use all of the oxygen delivered to it and the flow rate of unused oxygen back to the heart has a similarly simple form.
Oxygen return rate = CO x [O2] venous
Hence the rate of oxygen use by the body is equal to the blood flow rate multiplied by the difference in concentration between the supply and return vessels.
Oxygen consumption rate = CO x { [O2] arterial – [O2] venous }
This isn’t just an equation for you to remember, but an entire concept that is universally applicable to any “species” that obeys a conservation law (mass, momentum, energy, any chemical, etc.). Here is a simple application of this concept which validates something you already have a gut feeling for:
Body energy use rate = CO x { [nutrient energy] arterial – [nutrient energy] venous }
This equation states that the body cannot perform work any faster than the heart can deliver energy in the form of nutrient containing blood. The body’s ability to perform activity is strictly bounded by the cardiac output and the ability of the blood to acquire and relinquish nutrients. With the diminishing flow of energy to the body associated with heart disease, the level of energy use (activity) must decrease as well.