Student Syllabus Download
DETERMINANTS OF CARDIAC PERFORMANCE
Created by V’22 cardio group modified from Dr. John Rush
Updated 04/18/20
Introduction
Several determinants of cardiac performance can be described as preload, afterload, contractility, distensibility, heart rate, and synergy of contraction. These determinants influence variables that may be altered in order to make immediate adjustments to heart function. Multiple determinants can be influenced at any one time in order to adapt to current demands of the cardiovascular system – leading to short-term or immediate benefits (albeit with possible future detriment of long-term stress on the heart in disease states). Many of these determinants of cardiac performance have slightly different meanings to the cardiac physiologist vs the veterinary clinician, and we will try to explain both physiological and clinical applications below.
Key Terms
- Preload: diastolic wall stress
- Preload can be defined as the initial stretch of the cardiac myocytes prior to contraction. Preload is related to cardiac muscle sarcomere length
- Sometimes thought of (clinically) as the amount of blood in the heart at the end of diastole, since muscle length cannot be measured clinically
- Can be thought of as end-diastolic volume or end diastolic pressure, depending upon whether you are thinking of preload in a physiologic situation or a clinical situation.
- Frank-Starling Law of the Heart indicates that greater preload results in greater stroke volume (and thus increased cardiac output)
- Afterload: systolic wall stress.
- Afterload can be thought of as the pressure the heart must work against to eject blood during systole
- Can also be considered as the sum total of forces that must be overcome to eject blood from the heart
- Afterload is proportional to mean systolic blood pressure, so clinically the amount of afterload the heart is facing is sometimes “estimated” by the blood pressure
- Contractility: ability of the sarcomeres in the myocardium to shorten and eject a stroke volume
- Contractility can be thought of as the inherent strength and vigor of the heart’s contraction during systole
- Cardiac contractility can be defined as the tension developed and velocity of shortening of myocardial fibers at a given preload and afterload. It represents the intrinsic ability of cardiac muscle to generate a force that is independent of any load
- Heart rate: Number of times the heart beats each minute
- Typically, this is the pulse rate (unless there is arrhythmia)
- Synergy of contraction: sequential contraction of the atria/ventricles and symmetrical, uniform contraction of each chamber
- End-diastolic volume (EDV): volume of blood in the ventricle at the end of diastole, just before contraction of the heart
- End-diastolic pressure (EDP): pressure in the cardiac chamber before the initiation of contraction, at the end of diastole
- Distensibility: Property of the heart or blood vessels to increase chamber size to accommodate additional blood volume
- Often thought of as the elastic properties of the heart or arterial wall.
- Compliance: Compliance (C) is defined as the change in volume (ΔV) divided by the change in pressure (ΔP).
- The term compliance is used to describe how easily a chamber of the heart or the lumen of a blood vessel expands when it is filled with a volume of blood.
- A compliant heart can fill with a lot of blood volume without much change in end diastolic pressure
- End-diastolic pressure volume relationship (EDPVR): A property of the heart is diastole, represented by a curve, relating the blood volume in the heart to the distending pressure.
- Can be thought of as a measure of passive chamber stiffness
- End-systolic pressure volume relationship (ESPVR): Property of the heart, represented by a curve, relating the changed blood volume in the heart and pressure at maximal contraction.
-
- Can be thought of as the maximal pressure that can be developed by the ventricle at any given LV volume
- ESPVR is strongly influenced by contractility
Pressure volume relationship
The relationship between the pressure in the cardiac chambers and the volume in the cardiac chambers can be depicted in a loop, called the Pressure-Volume loop. In this diagram, the pressure in the left ventricle is depicted in the Y axis, and the volume in the heart is depicted in the X axis.
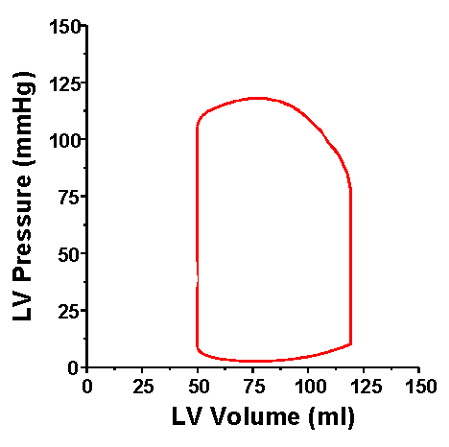
This pressure volume loop can tell us what is happening in the heart, and as certain things change (like preload or afterload) it can tell us how these changes affect the pressure or volume of the heart. So, to get oriented, let’s add a few labels to this diagram.

A points to the pressure and volume at the end of diastole, immediately before the ventricle starts to contract.
B points to the spot on the curve where the aortic valve opens, and the heart starts to eject blood. When blood is ejected from the ventricles, the volume of blood in the chamber decreases throughout systole.
C points to the end of the ejection phase of systole, where the aortic valve closes.
D points to the spot on the curve where the mitral valve opens, and the heart starts to fill with blood. This happens when ventricular pressure < atrial pressure, the atrioventricular valves open and the ventricles begin to fill.
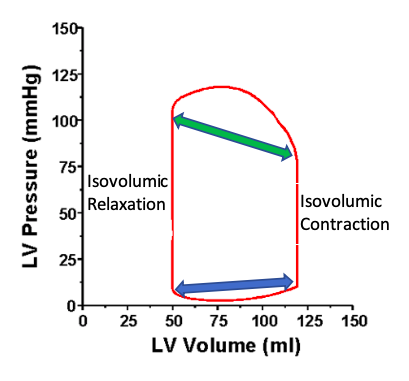
Thus the heart is filling during the phase represented by the blue double headed arrow along the bottom, representing diastole.
The heart is ejecting blood in the systolic ejection phase represented by the green double headed arrow along the top of the curve.
During the early phase of contraction of the heart, the vertical phase on the right of the diagram, the mitral valve is closed and the pressure in the ventricle is rising, but the aortic valve has not opened – this is the isovolumic phase of contraction, where the pressure is rising but no blood is leaving the heart, thus Isovolumic (the same volume) Contraction.
During the early phase of relaxation, the vertical phase on the left of the diagram, the aortic valve has closed and the pressure in the ventricle is dropping, but the mitral valve has not yet opened – this is the isovolumic phase of relaxation, where the pressure is falling but no blood is entering the heart, thus Isovolumic (the same volume) Relaxation.

- This diagram can also tell us about the systolic blood pressure (yellow arrow, about 120 mmHg), the diastolic blood pressure when the aortic valve opens (red arrow, about 80 mmHg).
- The double headed green arrow represents the stroke volume of the ventricle – The ventricle has approximately 120 ml of blood volume at end diastole, and 50 ml of blood at end systole when it is done ejecting blood, so 70 ml of blood left the ventricle, and this is the stroke volume.
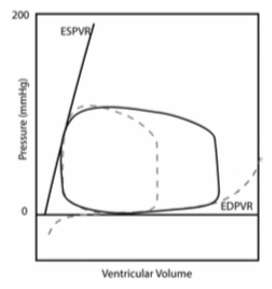
- We can also see both the pressure and the volume in the left ventricle at the end of diastole, just before the heart starts to contract (blue arrow). If we add or subtract blood from the ventricle then this point will move along a curve, and this curve is called the End-Diastolic Pressure Volume Relationship (EDPVR). If we add volume to the heart (say by giving a bolus of fluids) this point with move to the right and upwards. If instead we take away blood (by drawing blood out of the animal) then this point will move down and to the left. The picture below represents the End-Diastolic Pressure Volume Relationship (EDPVR).

For a given change in blood volume (delta V), there is a corresponding change in end-diastolic pressure (delta P) – see the figure below. EDPVR is influenced by intrinsic properties of the heart muscle – such as distensibility or compliance – which are inversely related to elastance or stiffness.

The End-Diastolic Pressure Volume Relationship (EDPVR) can be a very useful concept. If we add too much blood to the cardiovascular system, then the pressure at the end of diastole will rise, and this higher pressure can lead to congestive heart failure. For example, for the left ventricle of most animals, if the pressure rises much above 15 to 18 mm Hg then the pressure will be too high, and an animal might get pulmonary edema as blood back up into the lungs. Some ventricles get sick and get a lot of fibrous tissue in the ventricle, between the myocardial fibers, and thus they are less distensible. This sick ventricle has reduced COMPLIANCE. Thus, for a small change in volume there is a much bigger rise in pressure – so even small increases in volume can result in enough pressure rise to get congestive heart failure.
Another concept that can be helpful (but is sometimes harder to think about clinically) is the End-Systolic Pressure Volume Relationship (ESPVR). If you go to the point on the pressure-volume curve that is at the end of the ejection phase of systole, right when the aortic valve closes, you can see what the pressure and the volume are in the left ventricle (blue arrow below). If we were to draw a line that represented all of the different possible “end-systolic volume and pressure points” for a variety of different situations then we would have the End-Systolic Pressure Volume Relationship (ESPVR), and this line is depicted by the green bar on the diagram below.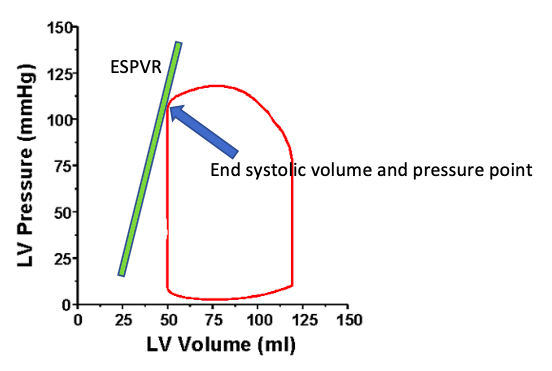
The green bar/line above, the End-Systolic Pressure Volume Relationship (ESPVR), is a reflection of the contractility of the heart. If the contractility of the heart were to drop, then this bar would move down and to the right. So, a few take home points:
- The upper and lower limits of the pressure volume relationship in the heart are represented by ESPVR and EDPVR, respectively
- The PVR for the entire heart changes continuously throughout the cardiac cycle between EDPVR at complete relaxation, and ESPVR at the strongest point of contraction.
- During diastole, when the myocardium has completely relaxed, the EDPVR is an independent property of the ventricle itself, whereas the ESPVR at the strongest point of contraction is influenced by the contractilityof the heart.
- Frank-Starling law: increase in preload leads to an increase in stroke volume
- Increasing the stretch of sarcomeres in the myocardium leads to increased calcium sensitivity and availability for contraction
Trying to tie it all together:
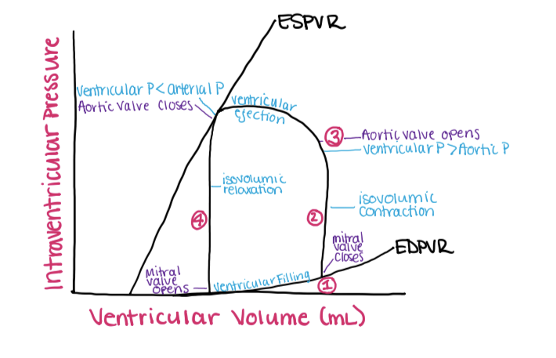
Point #1: Contraction is initiated – ventricular valves are sealed, holding the blood volume constant
Point #2: The PVR change is entirely dependent on pressure at this point (since the valves are shut and no blood can enter/leave) –isovolumic contraction. Any small contraction during this point will rapidly increase the pressure in the ventricle.
Point #3: When ventricular pressure > aortic pressure (or pulmonary artery pressure when referring to the right ventricle), isovolumic contraction ends and the semi-lunar valves open.
Point #4: Ventricular volume AND pressure begin to decrease
LaPlace Relationship
The LaPlace relationship represents mechanical wall stress (s)
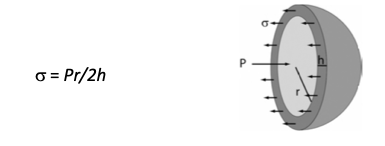
With greater chamber pressure (P), an increase in chamber size (r), or decreased wall thickness (h) there is an increase in ventricular wall stress. The heart would usually not like to work under a higher than normal wall stress, so the heart may try to compensate for higher wall stress. One of the ways the ventricle may compensate (in an attempt to reduce wall stress) is to have the sarcomeres in the heart muscle undergo hypertrophy, so the wall gets thicker, and then (by the Law of Laplace) wall stress returns toward normal.
- One example: in a dilated (volume overloaded) heart, the radius of the LV cavity will be increased relative to the wall thickness, and this will increase wall stress (according to the Law of LaPlace). The sarcomeres are now under greater wall stress, and to compensate the myocytes will undergo hypertrophy, and wall thickness (h) will increase (to decrease wall stress). A volume overload thus results in eccentric hypertrophy.
- Another example, if the pressure in the left ventricle is high (like in systemic hypertension) wall stress rises, and then the ventricle hypertrophies (concentric hypertrophy in this case) and wall stress heads back towards normal.

Alteration of the Determinants of Cardiac Performance: the following diagrams represent hypothetical scenarios in which one variable is changed, while the others are fixed. Theoretically, these would not happen in a clinical patient as multiple factors could be altered at the same time. However, these diagrams show the direct changes in other variables because of one being changed.
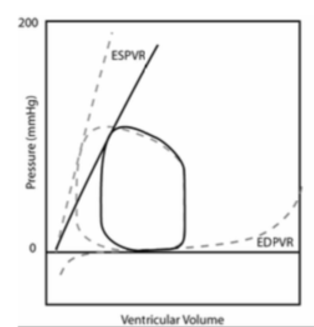
What happens if we increase Preload? Example: give IV fluids or a blood transfusion
The solid line represents the effects of a large increase in preload on a very distensible ventricle, while the dotted line shows a normal heart.
- Increased Stroke Volume (SV)
- Increased EDV → small increase in EDP (preload)
- Therefore, a minor increase in preload produces a significant increase in SV
- A normal heart is Preload dependent– small preload changes → larger SV changes
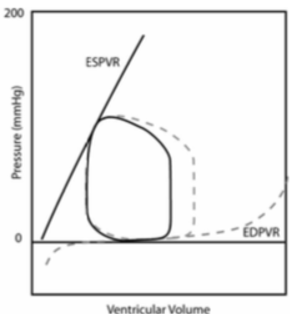
What happens if we increase Afterload? Example an abrupt increase in blood pressure
 The solid line in the image above represents the effects of increased afterload (short term) on a ventricle with fixed contractility, distensibility, and preload (i.e. vasoconstriction and increased vascular resistance is imposed), while the dotted line represents a normal heart.
- Increased afterload → decreased SV; increased end systolic volume
- Increasing afterload = increasing the pressure the heart ejects against, impairing the effectiveness of the heart to fully eject all blood from the ventricle during contraction.
- A normal heart is Afterload independent– increasing afterload does NOT produce a dramatic change in Stroke volume.
What happens if we reduce Contractility? For example, acutely reduce the contractile vigor of the heart with a beta-blocker
The solid line in the image above represents a heart with decreased contractility (i.e. heart disease has caused a reduction in the ESPVR), while the dotted line represents a normal heart.
- Decreased contractility decreased SV
- End systolic volume is increased
What happens if we decrease Distensibility? For example, a heart that suddenly get a lot of scar tissue and is less distensible….Ok, scar tissue takes time, but work with me….
The solid line in the figure above represents a heart with decreased distensibility, while the dotted line represents a normal heart.
- Decreased distensibility = reduced inability to relax
- This depicts a form of diastolic dysfunction– decreased rate and extent of relaxation of the ventricle. A component in many cardiovascular diseases.
- This often has reduced compliance, and so after some compensation (via the RAAS and sympathetic nervous system, etc.) fluid will be retained and small increases in LVEDV will lead to larger increases in LVEDP, and this can lead to congestive heart failure.
- Congestive Heart Failure = pathological elevation of pulmonary or systemic venous pressure, typically resulting from cardiac dysfunction and compensatory fluid retention, leading to edema formation in either the lungs or elsewhere in the body.
- In summary: diastolic dysfunction due to decreased distensibility → decreased SV because of a decreased EDV.
- Short term compensation: increased HR to counteract decreased SV
- Long term compensation: activation of Renin Angiotensin Aldosterone System and sympathetic nervous system → increased fluid retention → eventual congestion
What happens if we Alter Heart Rate?
CO = SV X HR
- Increasing HR → increased cardiac output in almost all situations
- If the heart rate is increased so much that there is not enough time for cardiac filling (e.g., heart rate > 280/minute in a dog) then you can possibly see decreased preload, and this will then drop stroke volume.
- Theoretically, an optimal HR will maximize CO – if HR is increased beyond this point, SV will decrease, leading to a decreased overall CO (it is important to remember that in states of disease, multiple factors can be changing simultaneously, which may lead to more complex interactions than discussed above)
- What happens if the heart rate is to slow? In diseases that cause bradycardia, cardiac output is immediately reduced (CO = HR x SV). In an attempt to compensate the heart may be able to increase stroke volume (SV), but this adaptation may take some time. Examples: Sick Sinus Syndrome and advanced forms of atrioventricular (AV) block
Where does Synergy of Contraction fit into this story?
- Synchronization and coordination of the heart as a pump
- Atrioventricular (AV) synchrony = the relationship between atrial and ventricular contraction
- Normally the atrial contract just before the ventricles, so the ventricles are primed with blood
- An atrial kickis the atrial contraction preceding the ventricular contraction. The atrial kick usually adds 10 to 25% of ventricular blood volume
- If there is a loss of AV synchrony (example: Third degree AV block where the atria and ventricles are beating independently, in an uncoordinated fashion) there is a loss of the atrial kick → ~10 to 25% decrease in SV
- Intraventricular synchrony = carried out by the Purkinje system, allows contraction of ventricular myocytes to occur in unison, with blood squeezed from the apex of the heart up toward the base and out the semilunar valves.
- Disease leading to loss of intraventricular synchrony → decreased efficiency of ventricular contractions → decreased SV
- Bundle branch block – One side of the ventricle contracts late and coordination is lost
- Ventricular ectopic beats – instead of the normal sequence of activation of the ventricle via Purkinje fibers, the ventricular activation might not be from apex toward the base, and stroke volume will be reduced.
- Disease leading to loss of intraventricular synchrony → decreased efficiency of ventricular contractions → decreased SV
What do people mean when they talk about Cardiovascular Reserves?
Overall cardiovascular reserve = measure of the ability of CV system to deliver oxygen to the tissues in response to increased demand.
- Dependent upon blood flowand oxygen extraction
- Maximum oxygen delivery → tissues is dependent upon cardiac output, the oxygen content of the arterial blood, and the ability of the tissues to extract additional oxygen out of the blood at the capillary level.
- With exercise (in a healthy heart):
- Heart rate will increase, and stroke volume will also increase >> increased cardiac output.
- Tissues will extract extra oxygen at the capillary level, and this will significantly decrease the oxygen content in venous blood to very low levels