Echocardiography Syllabus Download
Cardiac Ultrasound Basics
Revised by V’19 (cardio website) group from notes by Dr. Suzanne Cunningham
Introduction
Combining information obtained through 2-D and Doppler echocardiography allows us to assess cardiac structure and function and gain information about hemodynamics. Echocardiography provides both supplemental data in the evaluation of cardiac diseases, and a noninvasive method of acquiring some diagnostic information.
In many cases, Doppler-echo can serve as a substitute for expensive, invasive, and time-intensive procedures such as cardiac catheterization and angiography. However, it is important to remember that we cannot replace the acquisition of a thorough history, physical examination, thoracic radiography, or electrocardiography. Whenever possible an ECG is recorded during echocardiography for timing of cardiac events and to record the rhythm during the exam.
Advantages
- Echocardiography is a noninvasive technique
- Does not typically require anesthesia or sedation
- Provides anatomical information and allows us to examine the internal structures of the heart and great vessels
- Displays motion in real time, so that function of the valves and myocardial function can be evaluated.
1. “M-mode” (motion-mode) Echocardiography
- Introduction to M-mode echo – This modality displays valvular motion, cardiac chamber thickness and wall thickness, plotted against time (cardiac features on the Y axis, time on the X-axis).
- M-mode features:
- Allows accurate measurements of wall thickness and chamber dimensions (primarily of the left ventricle)
- Detection and quantification of hypertrophy patterns, which can then be followed over time
- Facilitates assessment of rapidly moving structures, such as cardiac valves
- Utilized to determine the following measures of cardiac performance: fractional shortening, ejection fraction, and systolic time intervals
- M-mode features:
- Cardiac Hypertrophy Patterns:
- Concentric hypertrophy – the ventricular wall thickens as a result of pressure overload. This increased wall thickness impedes on the ventricular chamber so that the volume of blood that can fit inside the ventricle is reduced.
- Eccentric hypertrophy – the ventricular wall dilates due to volume overload. In this case, the chamber size is increased relative to the ventricle wall thickness
- Right ventricle
- The internal chamber of the RV appears as an echo-free (i.e. black) zone near the top of the M-mode display. This chamber is much smaller than the chamber of the left ventricle in a normal animal. M-mode interpretation of RV chamber size is difficult except in cases of marked enlargement
- Tricuspid valve
- This valve can often be examined by M-mode, particularly in cases of RV enlargement. If both tricuspid valve leaflets are visible, their movement should resemble that of the mitral valve.
- Interventricular septum
- The motion of the IVS is evaluated, as is its thickness during systole and diastole. During systole, the normal IVS is expected to thicken and move downward on the M-mode display.
- Left ventricular chamber
- The LV chamber appears as the black space between the IVS and left ventricular free wall. This chamber’s internal dimension (LVID) and fractional shortening are important parameters in assessing LV cardiac function clinically.
- Fractional shortening: the change in internal dimension from diastole to systole, divided by the dimension in diastole:
- Left ventricular free wall
- The motion of the LV free wall is evaluated, as is its thickness during systole and diastole. During systole, the normal LV free wall is expected to thicken and move upward on the M-mode display.
- The LV chamber appears as the black space between the IVS and left ventricular free wall. This chamber’s internal dimension (LVID) and fractional shortening are important parameters in assessing LV cardiac function clinically.
- Mitral valve
- The two main leaflets of the left AV valve exhibit a characteristic motion and serve as an important landmark in M-mode studies.
- During early diastole, the “anterior” leaflet, which is closest to the transducer, swings open, (upward on the M-mode display, towards the IVS) to allow rapid filling of the Left ventricle. Mid-way through diastole, the mitral valve closes but will open again to allow further ventricular filling during the “atrial kick”, after which it will close completely. This motion can be seen on the display as an “M”.
- The “posterior” leaflet is somewhat smaller. Its motion inscribes a mirror image of the anterior leaflet motion (i.e. a “W”) as it swings away from the transducer, towards the LVW.
- Aorta/aortic valve
- The walls of the aorta move in unison as the heart moves in the thorax, so that they appear roughly parallel throughout the cardiac cycle.
- Left atrium
- the left atrial appendage appears as a black space beneath the aorta on an M-mode image.
- Left atrial to aortic ratio (LA:Ao) is a commonly used measure of left atrial size wherein the left atrium should be no more than 1.3X the size of the aorta. Despite the name of this measurement technique, we are actually measuring the left atrial appendage rather than the body of the left atrium. This measure is not a particularly accurate reflection of LA size, especially in the dog.
- Pericardium
- Appears as an echodense (i.e. white) tracing just beneath the epicardial surface of the LV free wall. In the case of pericardial effusion a black area may appear between the pericardium and the LV free wall.
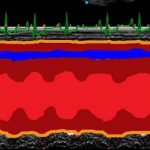
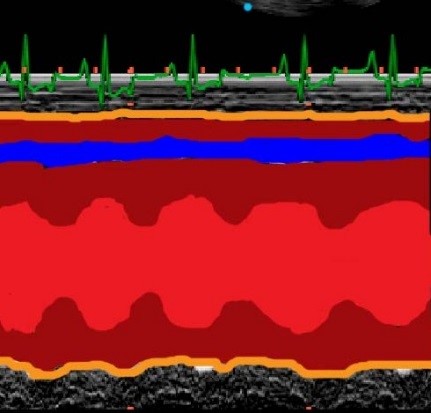
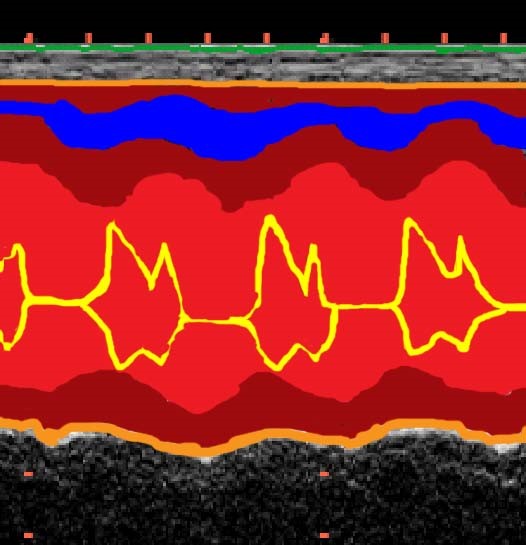
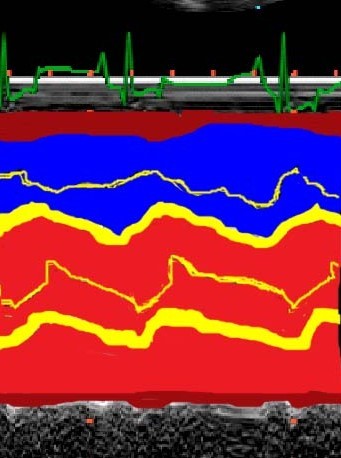
A 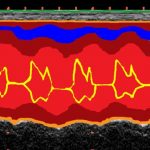
B 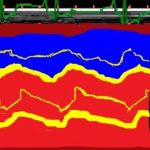
C M-mode views, colorized, of the LV (A), mitral valve (B) and aorta/left atrium (C). The right heart cavities are depicted in blue and the left heart cavities are depicted in red, brown is myocardium, and yellow is cardiac valves, while orange is the pericardium.
- Appears as an echodense (i.e. white) tracing just beneath the epicardial surface of the LV free wall. In the case of pericardial effusion a black area may appear between the pericardium and the LV free wall.
- The two main leaflets of the left AV valve exhibit a characteristic motion and serve as an important landmark in M-mode studies.
2. Two-dimensional (2D) Echocardiography
- Introduction to two-dimensional echo- This modality displays an anatomically meaningful tomographic image (slice) of the heart in real time.
- 2-D features:
- Allows visualization of anatomic defects of the heart in a context that does not distort structural relationships
- Downside: Any structures that do not lie in our plane of section cannot be seen without moving the transducer
- Hypertrophy patterns can be discerned
- Allows for superior evaluation of the right ventricle and both atria (compared to M-mode)
- Quantitative data can be derived by measuring distances or areas on the images displayed
- Allows visualization of anatomic defects of the heart in a context that does not distort structural relationships
- 2-D features:
- Echocontrast study can be utilized to supplement the standard 2D technique, for cases in which an intracardiac shunt is suspected. This procedure involves injecting an echogenic solution into a peripheral vein and utilizing 2D to observe any inappropriate movement of that contrast, esp. contrast that appears in the left ventricle.
- 2D echo images- From the right parasternal (RPS) position, there are two basic categories of views: short axis and long axis.
- Short axis views – slices the heart transversely, or in “cross-section” (as opposed to lengthwise). By making fine adjustments to the angle of the transducer (towards the base or apex of the heart), we are able to obtain a variety of different short axis views, in which, different structures are visible.
- Descriptions of short axis views, from apex to base:
- Apex– At this level, the left ventricle is the predominant chamber noted
- Level of papillary muscles-The diameters of the LV and RV chambers increase in size as we move towards the base of the heart. The papillary muscles of the LV can be seen as two bulges on the internal side of the left ventricular free wall, and the cavity may resemble a mushroom.
- Level of chordae tendinae– Angling further towards the heart base, the chordae tendinae appear in place of the papillary muscles and continue upwards to connect to the mitral valve leaflets.
- Level of mitral valve– At this level, the anterior and posterior mitral valve leaflets appear. Their characteristic double opening motion can be observed during diastole and has been described as having a “fish mouth” appearance.
- Base– Many structures can be visualized in the short axis view of the heart base. Locations of structures will be described in terms of a clock face with the aorta at the center. The three cusps of the aortic valve give it a characteristic three spoke wheel or “Mercedes-Benz sign” appearance. Keep in mind that breed, conformation, and pathology can greatly impact the appearance of these structures.
- The right ventricular outflow tract (RVOT) (1 to 4 o’clock)
- The pulmonic valve (PV) may be visible at 3-4 o’clock
- the left atrial appendage (LAA) (4 to 6 o’clock)
- The left atrium (LA) (6 to 8 o’clock)
- The Right atrium (RA) (8-10 o’clock)
- The tricuspid valve (TV) (10 to 12 o’clock)
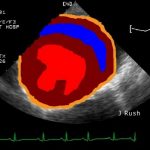
A 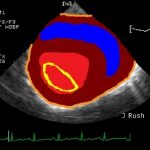
B 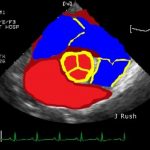
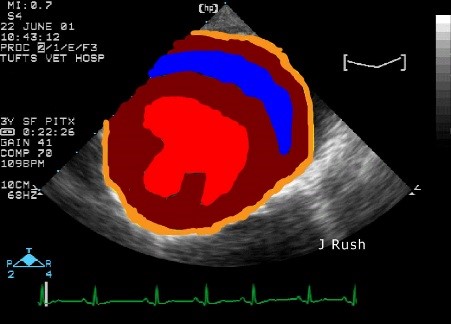
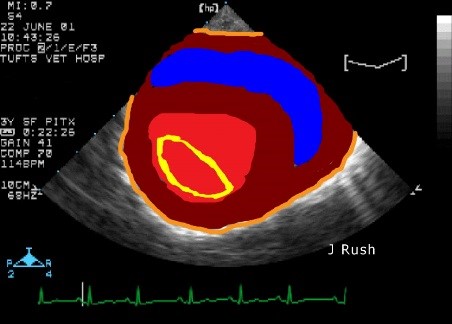
C Two-dimensional echo views, colorized, of the LV (A), mitral valve (B) and aorta/left atrium (C). The right heart cavities are depicted in blue and the left heart cavities are depicted in red, brown is myocardium, and yellow is cardiac valves, while orange is the pericardium.
- Long-axis views – are obtained by rotating the transducer clockwise 90° about its axis, from the short axis view, so that the scan plane slices the heart lengthwise, i.e., from base to apex.
- Caudal (4-chamber) long axis view —A long axis view which slices through the caudal aspect of the heart depicts the four chambers of the heart with the RV and RA in the near field, and the LV and LA in the far field. The main leaflets of the mitral (MV) and tricuspid (TV) valves can be seen as can chordae tendineae CT) and the “posterior” papillary muscle (PPM).
- Cranial (5 chamber) long axis view —By angling cranially, the LV outflow tract is imaged as it extends into the aorta next to the IVS. The left atrial atrium and sometimes appendage lies just beyond the aorta.


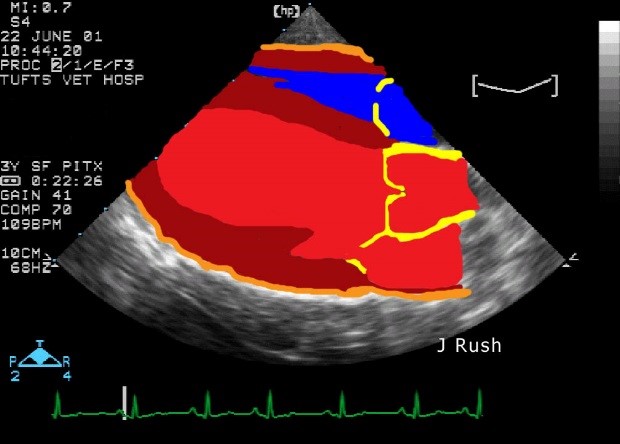
Two-dimensional echo views, long axis 4 chamber (A), and long axis 5 chamber (B). The right heart cavities are depicted in blue and the left heart cavities are depicted in red, brown is myocardium, and yellow is cardiac valves, while orange is the pericardium.
III. Doppler Echocardiography
- Introduction to Doppler echo-This modality provides a method of assessing blood velocity in the heart and great vessels, both qualitatively and quantitatively. However, Doppler is only able to image blood flow that is parallel to the ultrasound beam, meaning that we can only visualize the blood moving directly toward or away from the ultrasound probe.
- There are 3 main Doppler echocardiography modes:
- Pulsed-Wave (PW) Doppler displays blood velocity in a small region within the heart or blood vessel, called a sample volume and is valuable in determining location and timing of turbulence.
- Pulsed-Wave Features:
- Provides a means of evaluating flow
- A phenomenon known as aliasing limits the ability to measure high velocity flow.
- Tissue Doppler Imaging is a variation of pulsed wave Doppler which enables us to measure the velocity of myocardial motion. This modality provides information on cardiac filling pressures, as well as myocardial function during diastole and systole.
- Pulsed-Wave Features:
- Continuous-Wave (CW) Doppler is used to quantify peak ejection velocity through valves (and other orifices).
- Continuous-Wave features:
- Allows estimation of the difference in pressure across a valve utilizing a modified version of Bernoulli’s equation (which describes the conservation of fluid energy)
- P = 4 V2 where P is the pressure drop across the valve, and V is the peak velocity measured at the valve by CW
- Useful in evaluating the severity of stenotic valves, as well as indirectly measuring systemic or pulmonary arterial blood pressures
- Allows estimation of the difference in pressure across a valve utilizing a modified version of Bernoulli’s equation (which describes the conservation of fluid energy)
- Continuous-Wave features:
- Color-Flow (CF) Doppler utilizes color to represent velocity of blood flow.
- Color Flow features:
- Laminar flow is represented in red when blood is flowing towards the ultrasound probe, or blue as it flows away
- BART – [Blue Away, Red Towards]
- Turbulent flow is typically represented as either green or yellow.
- Typically used while viewing a 2D image
- Allows for rapid identification of abnormal flow and assessment of severity.
- Subject to aliasing, just like pulsed wave
- Laminar flow is represented in red when blood is flowing towards the ultrasound probe, or blue as it flows away
- Color Flow features: