Modern food networks, from production to consumption, are vulnerable to foodborne infections that cause outbreaks difficult to track and control. Many foodborne infections are notorious for frequent summer outbreaks. We use a time series approach applied to FoodNet data and various visualization tools to detect periods of high and low foodborne disease incidence, identify high risk geographic areas and potential driving factors, explore synchronization of foodborne outbreaks, and design disease calendar to ease the communication of complex spatiotemporal patterns.
Synchronization of Foodborne Outbreaks
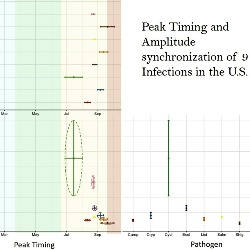
We introduce three metrics of seasonal disease synchronization: serial, phase-phase, and phase-amplitude. Serial synchronizations indicate general similarities of temporal patterns between two or more diseases, while phase-phase synchronizations indicate similarities in peak timing. Phase-amplitude indicate similarities in peak timing and amplitude for a given disease. We illustrate these features using nine notifiable infections reported to FoodNet in ten participating states in the U.S. Strong synchronization of foodborne infections across neighboring states helps identify high risk geographic areas, improve disease tracking, and characterize potential disease co-infections.
- Naumova EN, Simpson RB, Venkat A, Zhou B. (2019). Synchronization of Foodborne Disease Seasonality. Symposium on Networks in Food Systems & Nutrition. University of Vermont. Burlington, VT. (Oral Presentation)
- Simpson RB, Zhou B, Naumova EN. (2019). Foodborne Infections: Methods for Characterizing Seasonality. Analytics Without Borders Conference. Bryant University. Providence, RI. (Oral Presentation)
- Simpson RB, Zhou B, Naumova EN. (2019). Seasonality of Foodborne Infections: The Relationship Between Peak Timing and Amplitude. 17th Annual Freeman Symposium on Infectious Diseases. Harvard University. Cambridge, MA. (Poster Presentation)
Calendar of Foodborne Diseases
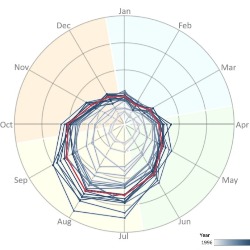
We use foodborne disease calendars to better communicate periods of high and low incidence within a calendar year. Well-constructed calendars allow to depict critical time points: when the period of high or low incidence starts, peaks, and when it ends. Calendars also help compare critical periods across diseases, locations, and affected populations. We develop various visualization tools, including calendars, for nine notifiable infections reported to FoodNet in ten participating states in the U.S.
- Zhou B, Simpson RB, Naumova EN. (2019). Visualizing Disease Seasonality: Challenges and Solutions. Analytics Without Borders Conference. Bryant University. Providence, RI. (Oral Presentation)
- Simpson RB, Zhou B, Naumova EN. (2019). Visualizing Disease Seasonality: Comparisons Across Space and Time. 17th Annual Freeman Symposium on Infectious Diseases. Harvard University. Cambridge, MA. (Poster Presentation)