Explore Cost and Nutritional Tradeoffs of the TFP Model Diet

Introduction
The Thrifty Food Plan (TFP) is the foundation of the Supplemental Nutrition Assistance Program (SNAP), which supported an average of 42.1 million people per month in 2023. Developed by the United States Department of Agriculture (USDA), the TFP estimates the lowest possible cost of a nutritionally adequate diet for a budget-conscious family of four. The USDA uses this model to determine the maximum SNAP benefit, making it a critical model diet for understanding food affordability and access in the US.
The USDA calculates the TFP using a mathematical optimization model that selects a diet as similar as possible to current consumption of a healthy-eating population in the US, while meeting cost, nutrient, and practicality constraints. The 2018 Farm Bill mandated a reevaluation of the TFP, leading to an average 21% increase in SNAP benefits in 2021. At a time when large cuts to SNAP benefits are being considered in the US Congress, the TFP Calculator may be used to understand and assess the adequacy of the maximum SNAP benefit under varying assumptions about prices, nutrition standards, and consumer preferences.
The TFP Calculator: A Hands-On Tool for Diet Modeling
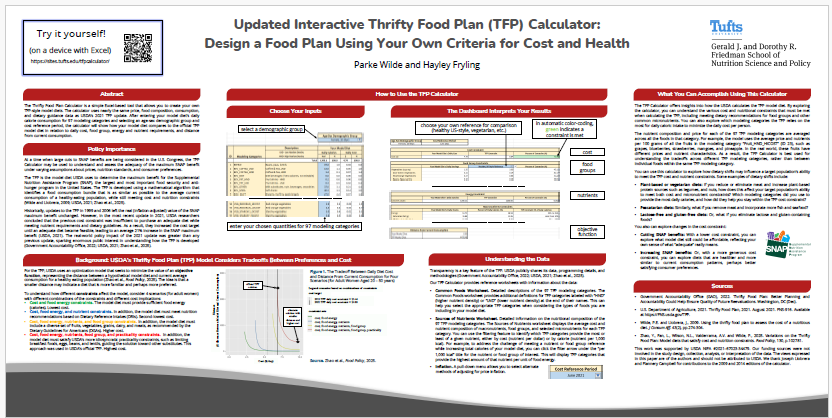
Developed by researchers at Tufts University’s Friedman School of Nutrition Science and Policy, the TFP Calculator is an interactive, Excel-based tool that allows users to design their own TFP-style model diet. This tool enables users to explore the complexities of meeting TFP constraints and understand the tradeoffs involved in designing a nutritionally adequate, cost-effective diet. Use the links below to download the TFP Calculator and read through the full user guide.
A Quick Guide: How to Use the TFP Calculator
For detailed instructions, download the User Guide above. Below is a quick overview of how to use the TFP Calculator. In the tool, only blue-colored cells should be edited.
Step 1: Enter Your Model Diet
Click the blue-colored tab labeled “Your Model Diet”. Begin by selecting the age-sex demographic group for your model diet and the cost reference period. Then, enter daily calorie consumption for each modeling category.

Step 2: Compare Your Model Diet to TFP Constraints
Click the yellow-colored tab labeled “Output”. The remaining cells of this worksheet summarize how your model diet compares to the TFP constraints, including cost, food groups, energy, nutrients, and distance from current consumption.

Key Insights and Contact
By using the TFP Calculator, you can understand the cost and nutritional constraints that shape the USDA’s TFP model diet and gain insights into the challenges of maintaining a healthy diet on a limited food budget.
For questions or technical support, please contact hayley.fryling@tufts.edu and parke.wilde@tufts.edu.
This work was supported by USDA NIFA #2021–67023-34479. Our funding sources were not involved in the study design, collection, analysis, or interpretation of the data. The views expressed in this paper are of the authors and should not be attributed to USDA.