For this small project, I learned how to collect GPS data and visualize it on a virtual map.
I’ve created a survey that collects information on favorite locations around Tufts University and around the Boston area using Survey123, a powerful tool for creating, sharing, and analyzing surveys. To create this survey, a set of questions must be determined first to select the appropriate input fields (i.e., rating, data, integer). For this survey, I request users to either search the physical address of the chosen location or leverage the GPS on a smartphone. The Latitude and Longitude components are extracted and saved in the survey as well as the date and time the response was recorded. I also query the type of location from a given selection of categories as well as the purpose of the establishment. Finally, the user inputs year first visited, number of times visited, as well as an image of the location (either provided by camera or web browser). Optional questions include a ranking of the establishment and any comments about the location. Below is a series of screenshots showing the questions from the mobile version of the survey.

After publishing the survey, you can access the survey through the Survey123 mobile App. A user can access my survey here, or through the following QR code:

Originally, data would’ve been collected “in the field” using a smartphone by walking around outside; however, due to the pandemic, data was collected by filling out the survey in a browser window.
I collected a total of 15 data points by entering the physical addresses of the locations of interest. A snapshot of the data and Map Viewer within Survey123 can be seen below.

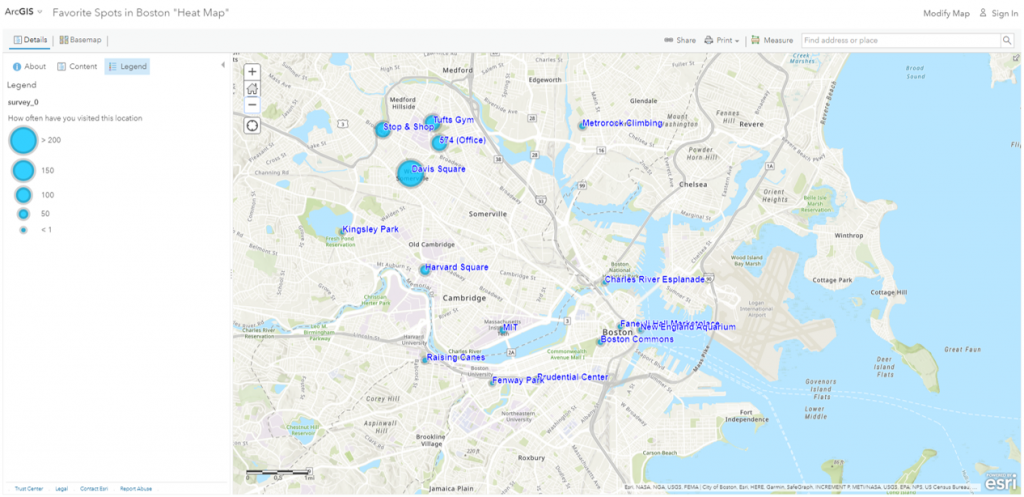
After collecting the data, I exported the survey results to a CSV file and imported it to ArcGIS Online Web Map where the data can be visualized. Users can also interact with the virtual map by clicking on the points to obtain further information about the chosen location (i.e., Latitude and Longitude of location, times visited, Name of establishment, and type of establishment). As part of the assignment, the data points must be stylized by at least one attribute. I decided to visualize the data points by frequency of visitations and represent the more frequently visited locations with larger circular markers. Here, a visitor can quickly determine that Davis Square is a place that I visit most often. Areas nearby such as the Tufts Campus are shown as the next most visited places, while areas in the Boston areas occur less often. Lastly, the names of the location are added in blue font to quickly inform the visitor exactly what is the establishment that I visited.
The finalized virtual map is down below and can be publicly accessed here.
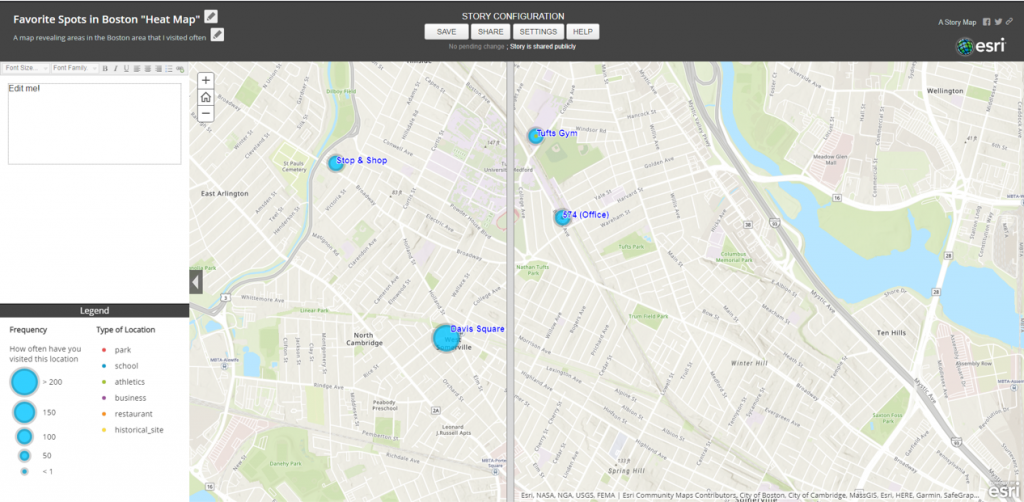
Finally, I created a publicly accessible Web App with my map to include a slide feature that reveals the ‘Type of Location’ for each establishment. A user can visually see both layers of my survey by sliding a window over. You can see this feature here, Swipe Map.