Music Mood Classification
Abstract
The article will cover the analysis of music using various DSP and music theory techniques involving rhythm, harmony, and spectral features. The emotional reaction to music is different for every person, so analyzing it will not likely yield perfect results. The method used then is to decide upon certain base songs that very closely embody a certain mood, and to match songs to these specific categories. These methods can be useful in determining the genre of music automatically for sorting large collections of digital music such as iTunes or Spotify. This article will discuss the engineering methods used to create these analyzation algorithms, and look at some of their results.
Introduction
The classification of music can be a difficult task since the emotional reaction between listeners can be fairly different for a given song. Much of the current organization for songs is based on an artist’s overall genre, rather than on the feeling generated by a song. Attempting to categorize music through engineering techniques is challenging, but can potentially help to minimize these discrepancies between listeners in the sorting process. Identifying the mood of a piece automatically would be extremely useful for sorting large collections of digital music such as those of iTunes or Spotify. The mood of a piece could also improve upon algorithms for identifying similar songs for online radio services like Pandora, basing the similarities on the song’s mood rather than on similar artists. Breaking a song down into quantifiable musical components such as rhythm, harmony, and timbre can allow for the matching of songs to specific categories based upon expected data for each type of mood.
Classification
In most existing methods of music mood classification, the moods of songs are divided according to psychologist Robert Thayer’s traditional model of mood. The model divides songs along the lines of energy and stress, from happy to sad and calm to energetic, respectively (Bhat et al 359). The eight categories created by Thayer’s model include the extremes of the two lines as well as each of the possible intersections of the lines (e.g. happy-energetic or sad-calm). The model can be seen in Figure 1.
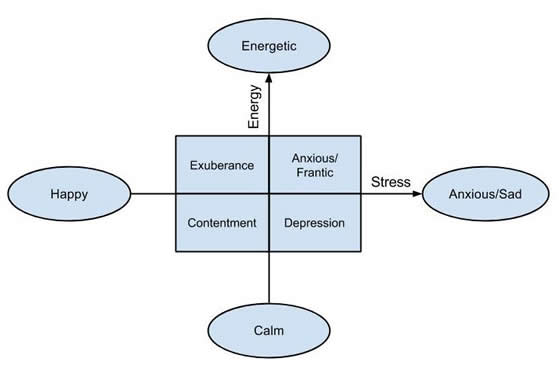
Figure 1
Thayer’s mood model. Source: Derived from Bhar (2014).
Faster tempos are associated with high-energy songs, and slower tempos with lower energy, sadder songs. Loudness, or intensity of a song can be connected with anger, while softer songs would suggest tenderness, sadness, or fear (Bhat et al 360). Higher overall pitch can be an indicator of happiness, carefree and light moods within a song, while lower pitch implies a darker, sad, and serious tone. Timbre, the tonal component of a piece created by harmonics, is a curious indicator of mood. According to a group of researchers from the BNM Institute of Technology in Bangalore, India, “timbre stimulates human energy levels without regard to rhythmic or harmonic saturation. Sound sources that have simple harmonic profiles have ‘darker’ timbres and tend to soothe human emotions” (Bhat et al 360). This same group of researchers produced a correlation table of intensity, timbre, pitch, and rhythm in identifying various moods, which can be seen in Table 1.
Table 1
Moods classified according to musical components. Source: Derived from Bhar (2014).
| Mood | Intensity | Timbre | Pitch | Rhythm |
|---|---|---|---|---|
| Happy | Medium | Medium | Very High | Very High |
| Exuberant | High | Medium | High | High |
| Energetic | Very High | Medium | Medium | High |
| Frantic | High | Very High | Low | Very High |
| Anxious/Sad | Medium | Very Low | Very Low | Low |
| Depression | Low | Low | Low | Low |
| Calm | Very Low | Very Low | Medium | Very Low |
| Contentment | Low | Low | High | Low |
Table 1 shows all eight of Thayer’s mood classifications with the relative degree of different musical components found in each – from very low to very high. Higher energy moods such as happy, exuberant, and energetic all have generally higher amounts of intensity, timbre, pitch, and rhythm than lower energy moods such as calm, contentment, and depressed. To understand how these different ratings are found, we will now explore how various methods of digital signal processing (DSP) can be used to identify the musical components such as rhythm, pitch, intensity, and timbre from a piece.
Acoustical Analysis
When we hear music, our ears are interpreting an analog signal – the vibration of air molecules around us. Audio is recorded onto a computer through the process of sampling – capturing the magnitudes of sound vibrations at many points in time and then storing them digitally. A single magnitude in time is referred to as a sample. For CD quality recordings, there are 44,100 samples representing each second of music, with the magnitude of each sample represented by a 16-bit value. When played back from the computer, these varying magnitudes correspond to a varying voltage on the audio output from the sound card, which will eventually move the cones of some form of speakers after being amplified. These numerous samples are the same information that will be analyzed to extract the musical components of a piece.
The tempo, or the speed of the music, makes up a large part of quantifying the rhythm of a piece. Tempo can be identified through extracting a beat spectrum from the audio, then determining the frequency of the beats. A beat is defined as an accented (stronger or louder) note within the piece, that is generally repeated periodically. Once beats are identified, the distance between matching series of beats can be measured (Bhat et al 360). For example, in most forms of rock music played in 4/4 time the, strongest hit of the kick drum will be on beat 1 of 4 and the strongest hit of the snare drum will be on beat 3 of 4. These hits should be easy to detect since the amplitude of the music on beats where the drums hit is likely to be significantly louder than on off beats without drums. Identifying this accented 1 and 3 pattern would allow one to then find the length of the 4/4 repetition (one measure) and from that determine the BPM of the song. The song’s tempo has a strong connection with the perceived energy level.
Timbre is the tonal quality of a sound, caused by its harmonic components. These harmonics give an instrument its own unique sound – this is why middle C on a piano can be clearly differentiated from the same note on a violin. The difference in timbre between two instruments playing the same note can be easily determined by analyzing their frequency responses over the note’s duration. Finding the difference for an entire piece of music is more difficult. Two of the properties that are analyzed within full songs are the zero-crossing rate and spectral irregularity. Zero-crossing rate is the speed at which a signal crosses the zero line, where output voltage is zero. This zero point can be seen in Figure 2. The zero-crossing rate can be a good indicator of the noisiness of a signal. Spectral irregularity is the degree of variation between successive peaks along the frequency spectrum. It is found by taking the sum of the squares of the difference in amplitude between adjacent peaks. Larger amounts of these two values would be indicative of a larger amount of harmonics, and a more saturated overall tone for the piece. More timbre in a song would indicate higher energy, as can be seen by the values in Table 1. The four higher-energy moods at the top of the table all have a timbre value of medium or greater, and the four lower-energy moods have a timbre of low or very low.
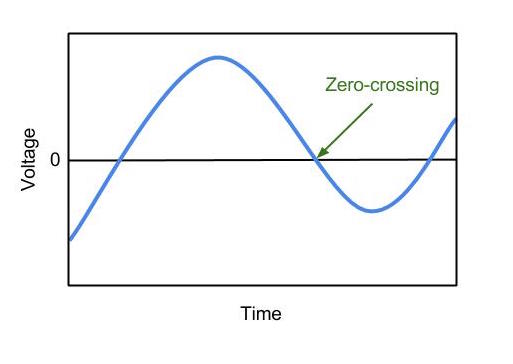
Figure 2
Zero-crossing point of a signal. Source: Derived from Bhar (2014).
Pitch is the frequency of a sound, which can be determined by the speed of vibrations or the size of the vibrating object. Higher pitched, higher frequency sounds are produced by faster vibrations, and lower pitched sounds are produced by slower vibrations. Pitch is a very good indicator of a songs placement relative to the amount of stress in Thayer’s model. As could be expected, higher pitched songs fall into the categories of happy, exuberant, or energetic, while lower pitched songs fall into the categories of anxious/sad, calm or depressed.
The intensity, or loudness of a song is considered to be the average volume across its entirety. Loudness can be a strong indicator of a song’s position with respect to the amount of energy in Thayer’s model. The major quantitative component of intensity is the amplitude of the waveform. This is done by calculating the RMS (root mean square) of the signal. The RMS is found by taking the root of the average of a number of amplitudes squared. A higher RMS would indicate a higher intensity, and a lower RMS would suggest a lower intensity, calmer piece.
The engineering challenge of music mood analysis comes with developing and improving upon algorithms to analyze these musical components of a signal, and then make a decision based upon their relative amounts. This analysis also relies heavily on a number of pre-existing DSP algorithms such as the fast Fourier transform (FFT), which will take a signal from the time domain and display the amounts of various frequencies present. Algorithms for analysis tend to run slowly, and their speed can be improved through code optimization. Their accuracy can also be improved through further experiments and collection of data on various song types.
Experiments
This section will compare and contrast the results of a number of experiments done to classify songs based on various audio features. The first will be that of a group of engineers at the BNM Institute of Technology in Bangalore, India. The group used an algorithm identifying amounts of intensity, timbre, pitch, and rhythm in a number of songs across moods. Once these audio features were extracted, they were compared against pre-determined threshold amounts found for each mood in order to make the classification decision (Bhar et al). The average amount of each audio feature found in specific moods from the experiment is displayed in Table 2, shown below.
Table 2
Mean values for audio features found across moods. Source: Derived from Bhar (2014).
| Mood of Western songs | Mean Intensity | Mean Timbre | Mean Pitch | Mean Rhythm |
|---|---|---|---|---|
| Happy | 0.2055 | 0.4418 | 967.47 | 209.01 |
| Exuberent | 0.317 | 0.4265 | 611.94 | 177.7 |
| Energetic | 0.4564 | 0.319 | 381.65 | 163.14 |
| Frantic | 0.2827 | 0.6376 | 239.78 | 189.03 |
| Sad | 0.2245 | 0.1572 | 95.654 | 137.23 |
| Depression | 0.1177 | 0.228 | 212.65 | 122.65 |
| Calm | 0.0658 | 0.1049 | 383.49 | 72.23 |
| Contentment | 0.1482 | 0.2114 | 756.65 | 101.73 |
Intensity and timbre within Table 2 are given as normalized values – they should simply be viewed relative to one another. Pitch is given as a frequency in Hz, number of cycles per second, and rhythm is given as a number of beats per minute. It can be seen that these values correspond very well to the expected trends stated in the previous section on acoustical analysis. Average rhythm in beats per minute for higher energy moods such as happy or frantic is nearly double that for lower energy moods like calm or contentment. Average pitch for lower stress moods such as happy or contentment is similarly much higher than that for higher stress moods such as sad or depression. The results of the classification process based on these values can be seen in Table 3, shown below.
Table 3
Experimental results for identifying songs based on audio features. Source: Derived from Bhar (2014).
| Mood | No of Songs | % Efficiency |
|---|---|---|
| Happy | 13 | 92.31 |
| Exuberent | 14 | 85.71 |
| Energetic | 18 | 94.44 |
| Frantic | 6 | 66.67 |
| Sad | 9 | 77.78 |
| Depression | 10 | 90 |
| Calm | 17 | 94.11 |
| Contentment | 20 | 85 |
The most successfully identified moods were energetic, calm, and happy, respectively. The percent accuracy for these – each above 90% – is very impressive. For mood classification to be commercially viable, an algorithm will need to be very accurate. Having to correct for a significant number of errors after identification would detract value from the use of the algorithm, since it is meant to minimize the amount of human time spent listening to individual pieces. However, it is likely that pieces identified incorrectly may have been placed in neighboring moods – for example a calm song may be wrongly identified as contentment. These areas of the mood scale may be difficult for even a trained expert to discern between.
Future/Current Use
In current music search systems such as iTunes or Spotify, songs are identified by a predefined genre, selected by the artist when albums or singles are submitted. Suggested albums or artists on iTunes for example may be determined by examining the musical habits of users. For example, a post may appear below an album displayed in the application saying something such as “users who liked this also liked X”. This process of identifying similar music is helpful for a store application such as iTunes to identify similarly liked artists or albums, but fails when looking on a song to song basis. Think of an artist that has both upbeat and ballad songs – one would ideally want to suggest a ballad from another similar artist following the purchase of a ballad by the first artist.
This technology for identifying a song’s mood exists but it has not been put into practice in commercial music stores to this point. However, internet radio applications such as Pandora have began to implement more analytical methods in its playlist creation process. Pandora itself is based upon the Music Genome Project, an attempt at analyzing song structure to identify similar songs launched by Tim Westergren in 2000. The project is continually updated, and as of May 2006, its library contains over 400,000 songs from more than 20,000 contemporary artists (Joyce). Songs in the library are analyzed by musical experts on up to 450 musical characteristics. With the Music Genome Project’s work Pandora feels they are better able to recognize and respond to an individual’s tastes, and they suggest that, “The result is a much more personalized radio experience” (Pandora.com).
Conclusion
Breaking a song down into quantifiable musical components such as rhythm, harmony, and timbre can allow for the matching of songs to specific categories based upon expected data for each type of mood. This system of classification is not perfect, but can be useful for a variety of technical applications – be it identifying songs of similar mood for online radio or automatically arranging large catalogs of music such as iTunes. The usefulness of the application will depend on both the accuracy of results and the speed at which classification algorithms can be used.
Bibliography
- Bhat, A. S., V. S., A., S. Prasad, N., & Mohan D., M. (2014). An efficient classification algorithm for music mood detection in western and hindi music using audio feature extraction. 2014 Fifth International Conference on Signal and Image Processing, pp. 359-364. DOI: 10.1109/ICSIP.2014.63
- Joyce, John (Virginia’s State Division, Consolidated Laboratory Services, United States). Pandora and the music genome project: Song structure analysis tools facilitate new music discovery. Scientific Computing, v 23, n 10, p 14+40-41, September 2006 [Cannot verify this citation]
- Pandora.com,. N.p., 2015. Web. 18 Feb. 2015. [Provide URL to site; provide “corporate author” for Pandora]
Suggested Reading
- Trung-Thanh Dang; Shirai, K., “Machine Learning Approaches for Mood Classification of Songs toward Music Search Engine,” Knowledge and Systems Engineering, 2009. KSE ’09. International Conference on , vol., no., pp.144,149, 13-17 Oct. 2009z. DOI: 10.1109/KSE.2009.10