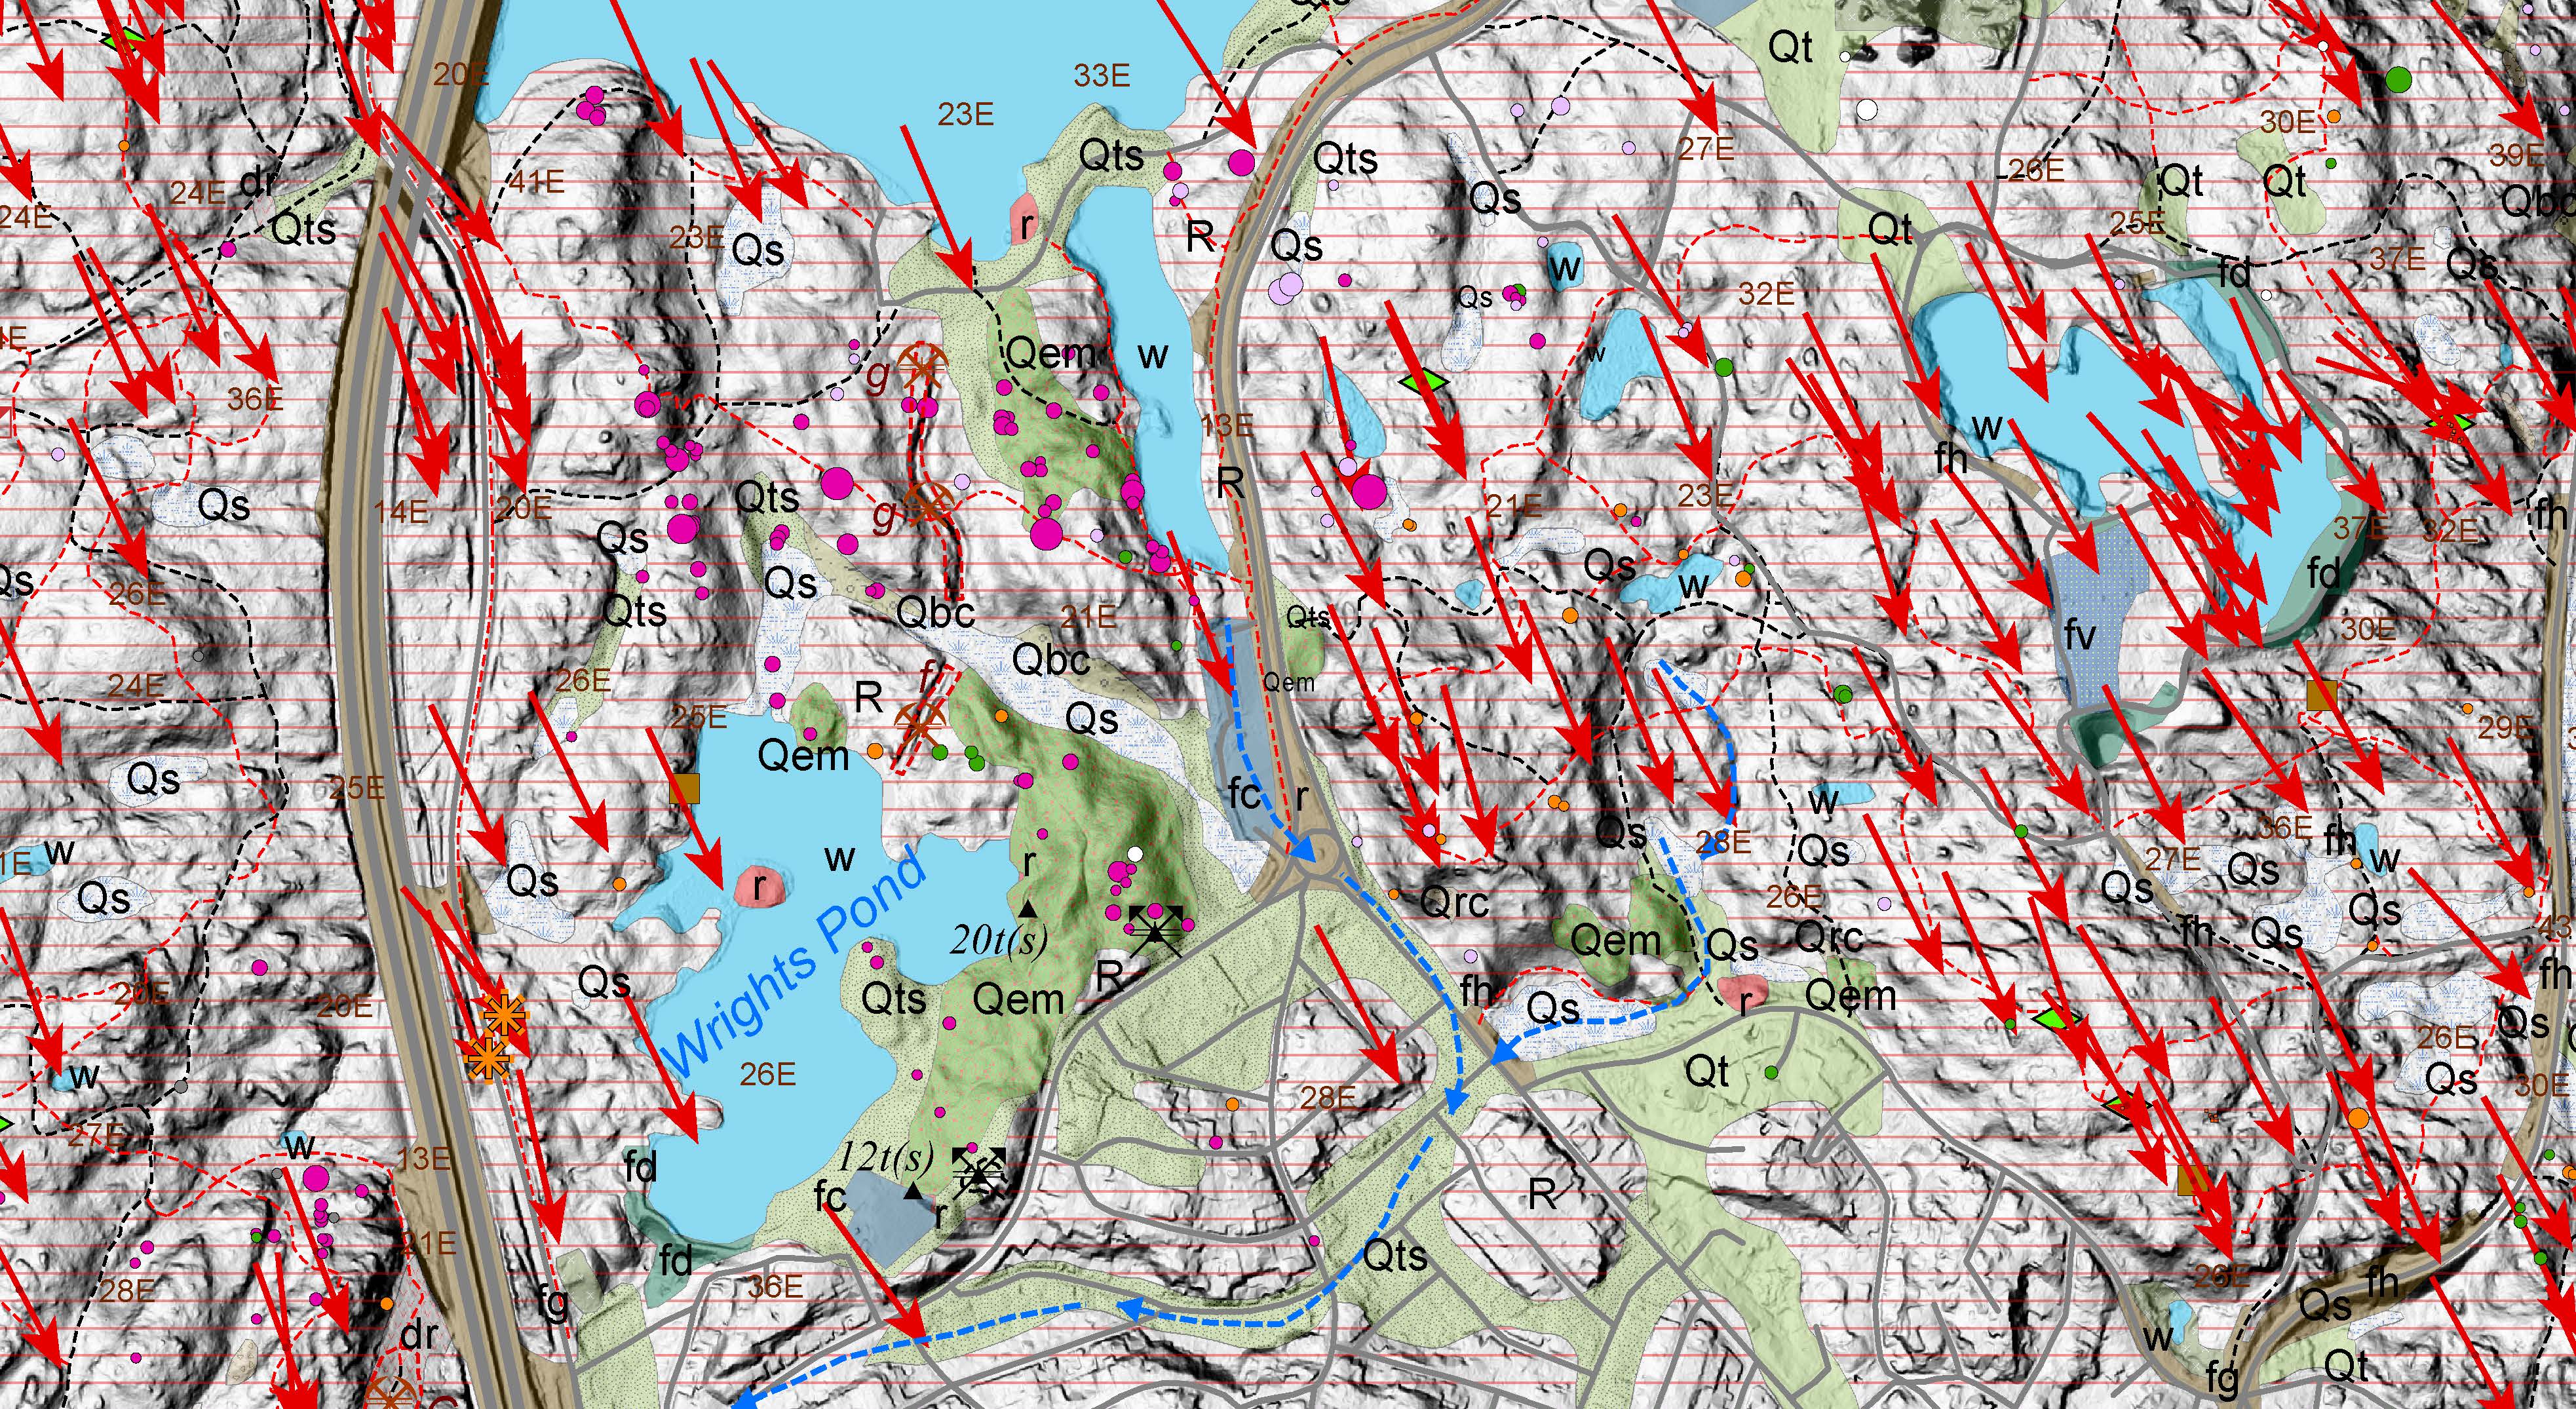
A surficial geologic map is a geologic map showing the loose materials that cover the bedrock surface below and where bedrock is exposed at the land surface. The character of surficial deposits varies from place to place, but here in the New England surficial deposits are dominated by glacial sediment.
Below you may download the most current version of the surficial geologic map of the Middlesex Fells and its explanation of map units and symbols. This project is ongoing research by me, Jack Ridge. I am a professor in the Dept. of Earth and Climate Sciences at Tufts University, Medford, Massachusetts. For more about me go to: http://ecs.tufts.edu/people/ridge.htm.
Please be aware that the map and its explanation are ongoing research that will be updated periodically as new information is obtained or as interpretations change or are refined. This is truly a work in progress.
If you decide to use information on the surficial map please reference it as follows with the date the web site was accessed:
Ridge, J.C., 2019, The Surficial Geology of the Middlesex Fells Reservation (version: Dec. 5, 2019): Map (scale: 1:5000) and explanation (5 p.) https://sites.tufts.edu/fellsgeology/
Any comments or suggestions that you would like to send to the author can be sent to me at: jack.ridge@tufts.edu. I welcome feedback and questions.
The most recent update posting: December 5, 2019
Download of surficial geologic map and explanation of the Fells:
Surficial map: FellssurficialMAPDec5-2019.pdf
Full surficial map explanation: FellssurficialEXPLANATIONDec5-2019.pdf
Information about the map and downloads:
What is a surficial geologic map? The surficial geologic map classifies the loose geologic deposits that cover the solid bedrock surface below. The map also shows features created by land surface processes. In the Boston area this is mostly the sediment and features left behind by glaciers that once covered the area during successive glaciations over approximately the last 2.5 million years. For example, the map will show thick deposits of till (sediment deposited by glaciers) as well as the orientation of glacial striations and grooves resulting from glacial ice sliding across the bedrock surface. The last glaciation covered the land surface in the Fells with glacial ice between about 35,000 to 17,000 years ago. This is known as the Wisconsinan Glaciation, named after deposits in Wisconsin. At its maximum extent in eastern New England the last glacier expanded to the islands of Nantucket and Martha’s Vineyard and expanded out across the continental shelf east of Cape Cod, while covering the Boston area with ice about a mile thick.
Surficial geologic maps also show modern stream and river deposits, coastal deposits, wetlands, and deposits created by rock disintegration. Surficial maps show where the bedrock surface is exposed but they do not attempt to classify the bedrock into different formations or rock types. Thus, surficial deposits in the Boston area may be thin, where there is a lot of exposed bedrock, but they can also be more than 100 meters thick. Thick glacial sediment occurs beneath Boston Harbor where there are drumlins (streamlined hills made of glacial sediment).
Why a new map? Field mapping is something I enjoy and throughout my career I have been involved in projects that usually involve surficial mapping of glacial sediment. I have worked in Warren County in New Jersey, Northampton County in Pennsylvania, the western Mohawk Valley of central New York, and in the Connecticut Valley of southern New Hampshire and Vermont (Westmoreland to Claremont, NH and Putney to Ascutney, VT). Living in Medford, and taking many hikes in the Middlesex Fells, peaked my curiosity about the geologic history of the Fells area. Making a surficial map of the Fells seemed like a perfect fit and a surficial geologic map of the Fells had never been produced except as part of large regional maps that did not show the detail of the geology. They just don’t give much information. The last map produced was by Laurence LaForge of the US Geological Survey in 1932. The Fells area was included on LaForge’s map but is only a tiny part of the map. (See below and LaForge, L., 1932, Geology of the Boston area, Massachusetts: U.S. Geological Survey Bulleting 839, 105 p., 2 plates)
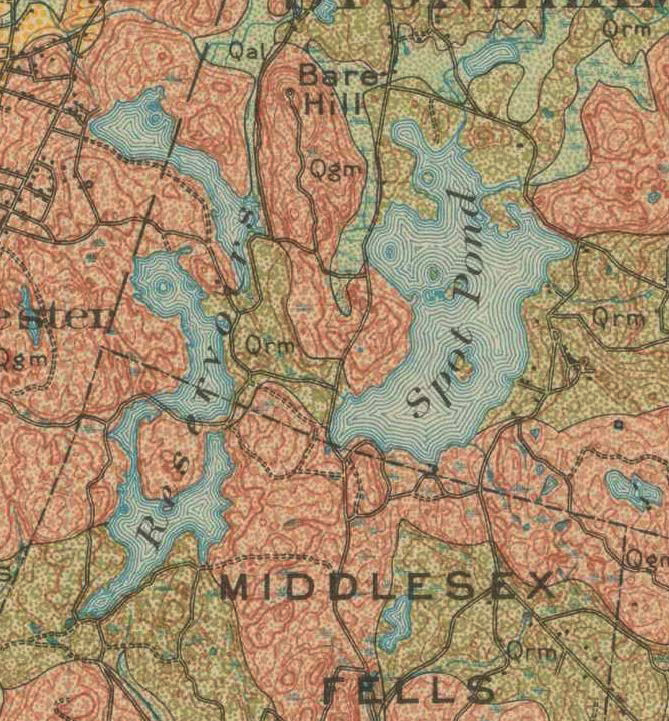
Qrm is recessional moraine. Qgm is ground moraine.
Ground moraine is areas of mostly bedrock exposure with thin glacial sediment.
Research on the History of Glaciation: Another motivation I had for making a surficial map of the Fells was that this area represented an interesting research project. The exact time when the last ice sheet left the land surface, or the age of deglaciation, during the last or Wisconsinan Glaciation has not been determined in the Fells or in the Boston area with any precision. Glacial geologists usually determine these ages using radiocarbon dating but this requires a piece of organic material (plant leaves, wood, bones, shells, etc.) from the time of the event that you are trying to date. The best fossils for doing this are wood and plant leaves from terrestrial plants. Unfortunately, none of this material from the time of deglaciation has been found in the Fells and is very scarce to non-existent in nearby areas.
About 20-30 years ago a new dating technique called cosmogenic nuclide surface dating (or just “surface dating” or “cosmogenic dating”) became available for obtaining the age of deglaciation. This technique takes advantage of the abundance of isotopes produced by cosmic radiation bombardment of Earth’s surface. As cosmic radiation bombards Earth it creates unique isotopes that buildup in the rock surface, such as beryllium-10 (10Be), aluminum-26 (26Al) and chlorine-36 (36Cl). Glacial erosion can strip all previously accumulated cosmogenic isotopes from bedrock surfaces, including the tops of large boulders, as the ice slides across the land surface. Beneath a glacier, rock surfaces and boulders are also shielded by the ice from new cosmogenic isotope formation. Not until a glacier recedes, and leaves the rock surfaces and boulders exposed again, do cosmogenic isotopes begin to re-accumulate. From the time the glacier leaves there is a buildup of the cosmogenic isotopes that become more abundant in the exposed surface over time. From some complicated physics we (“we” meaning the physicists!) are able to estimate the rate at which different cosmogenic isotopes are formed in rock surfaces. The most useful isotope for doing this study is 10Be. So, simply expressed:
(Age of the rock surface or time since glacier left in yr) =
(10Be concentration in the rock) / (rate of 10Be accumulation per year)
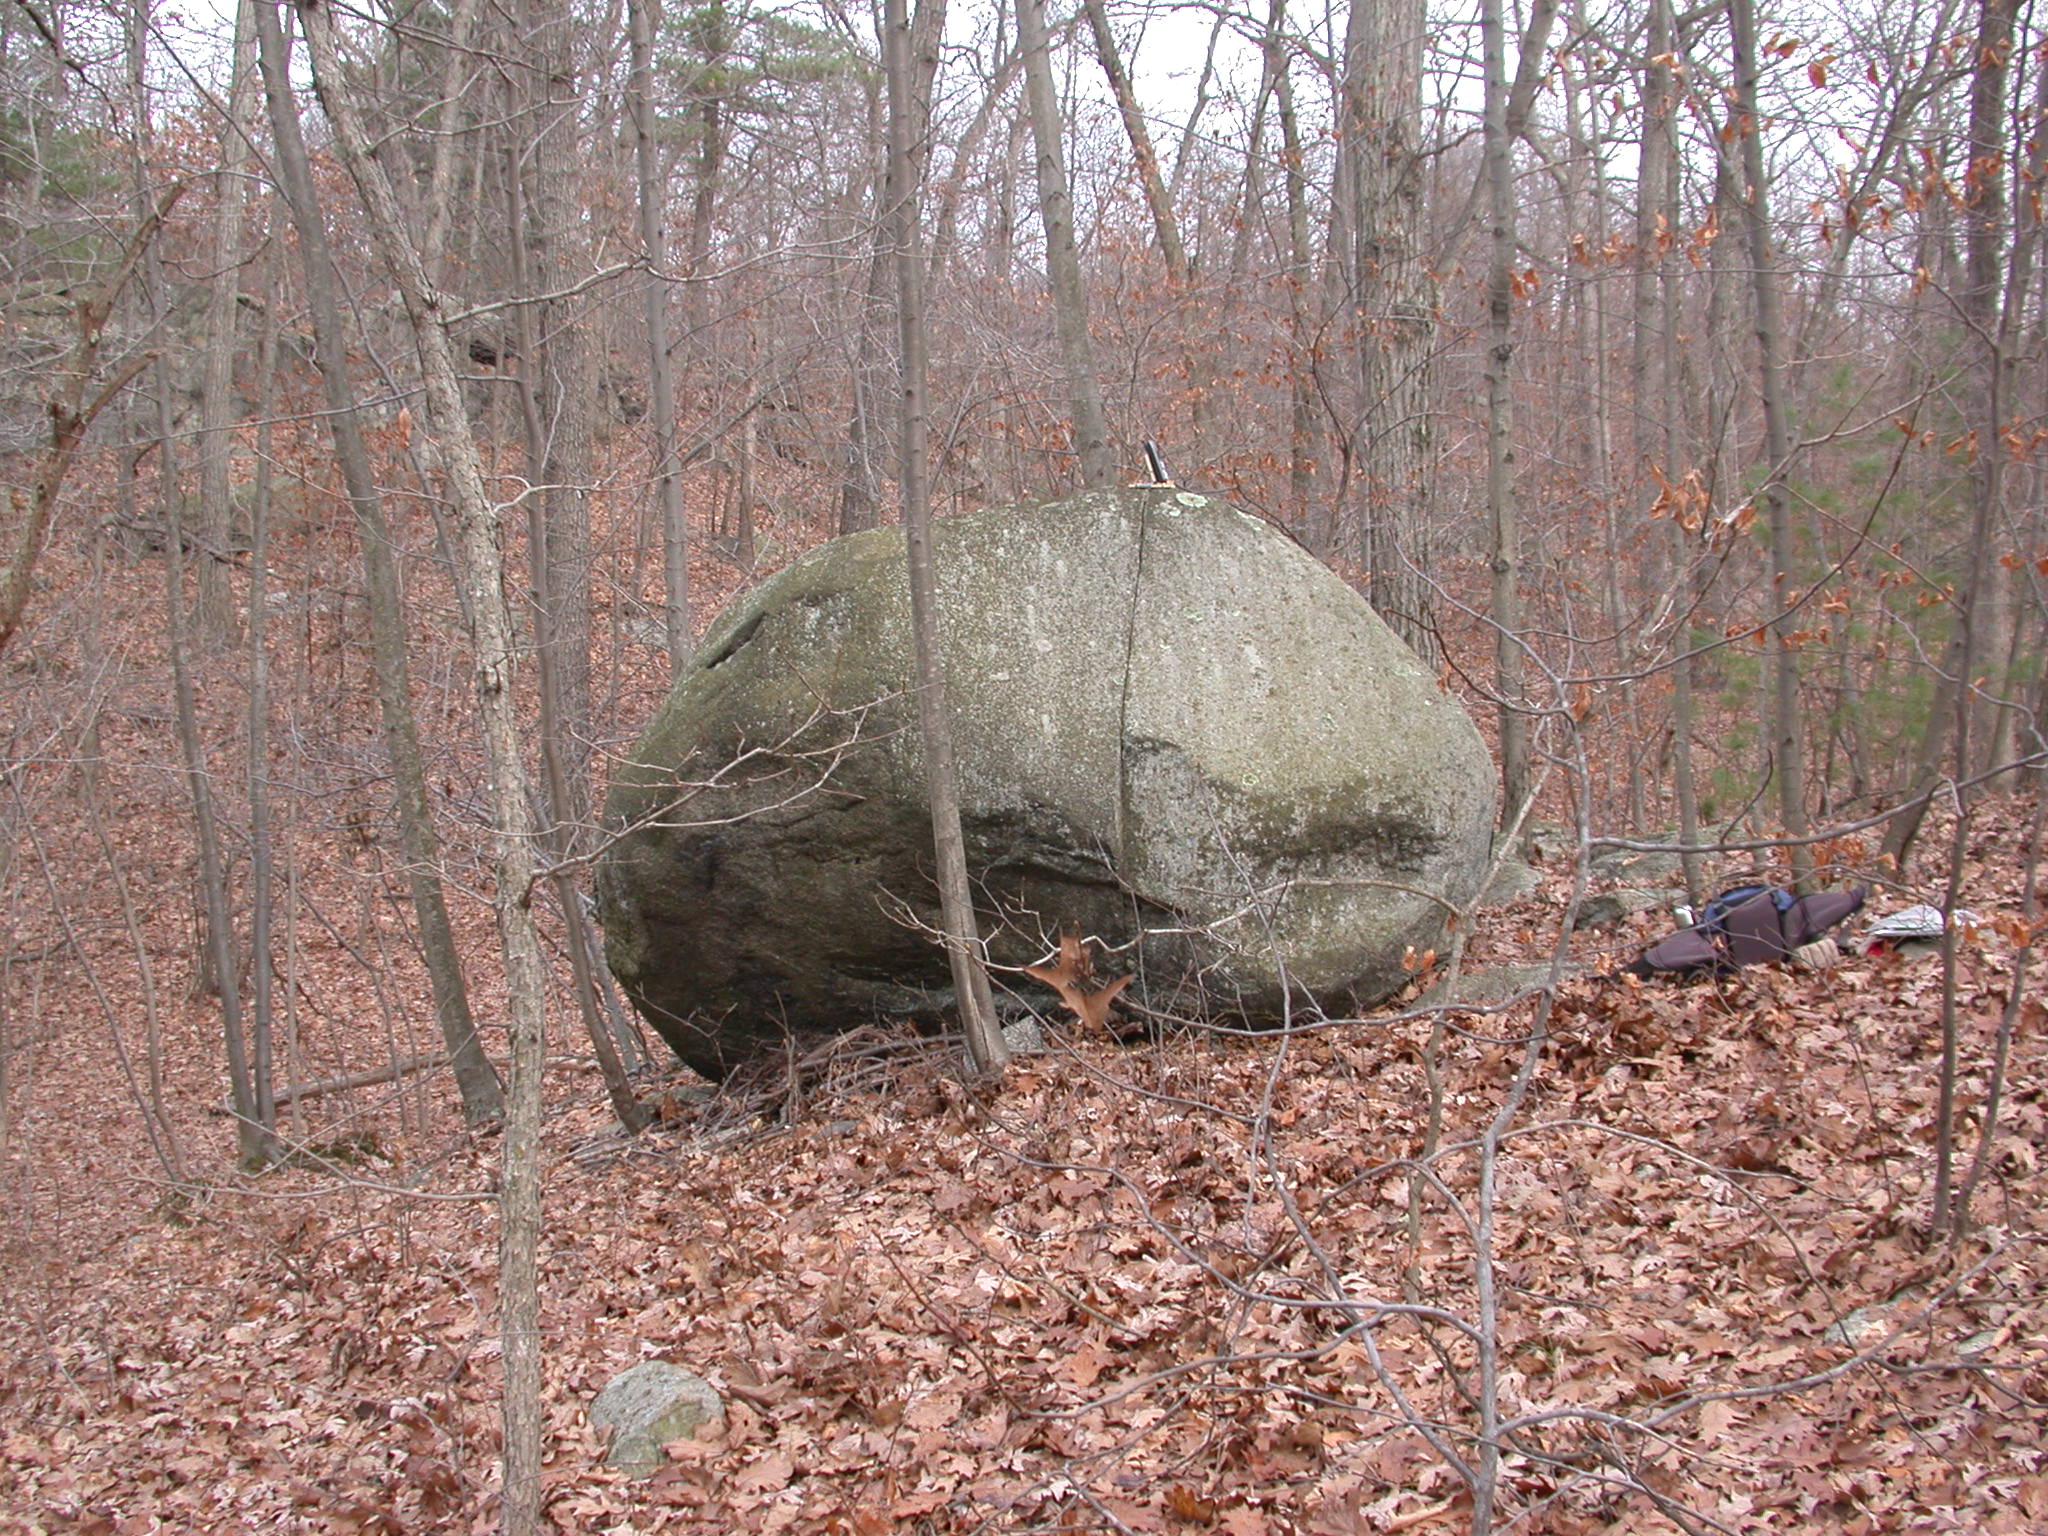
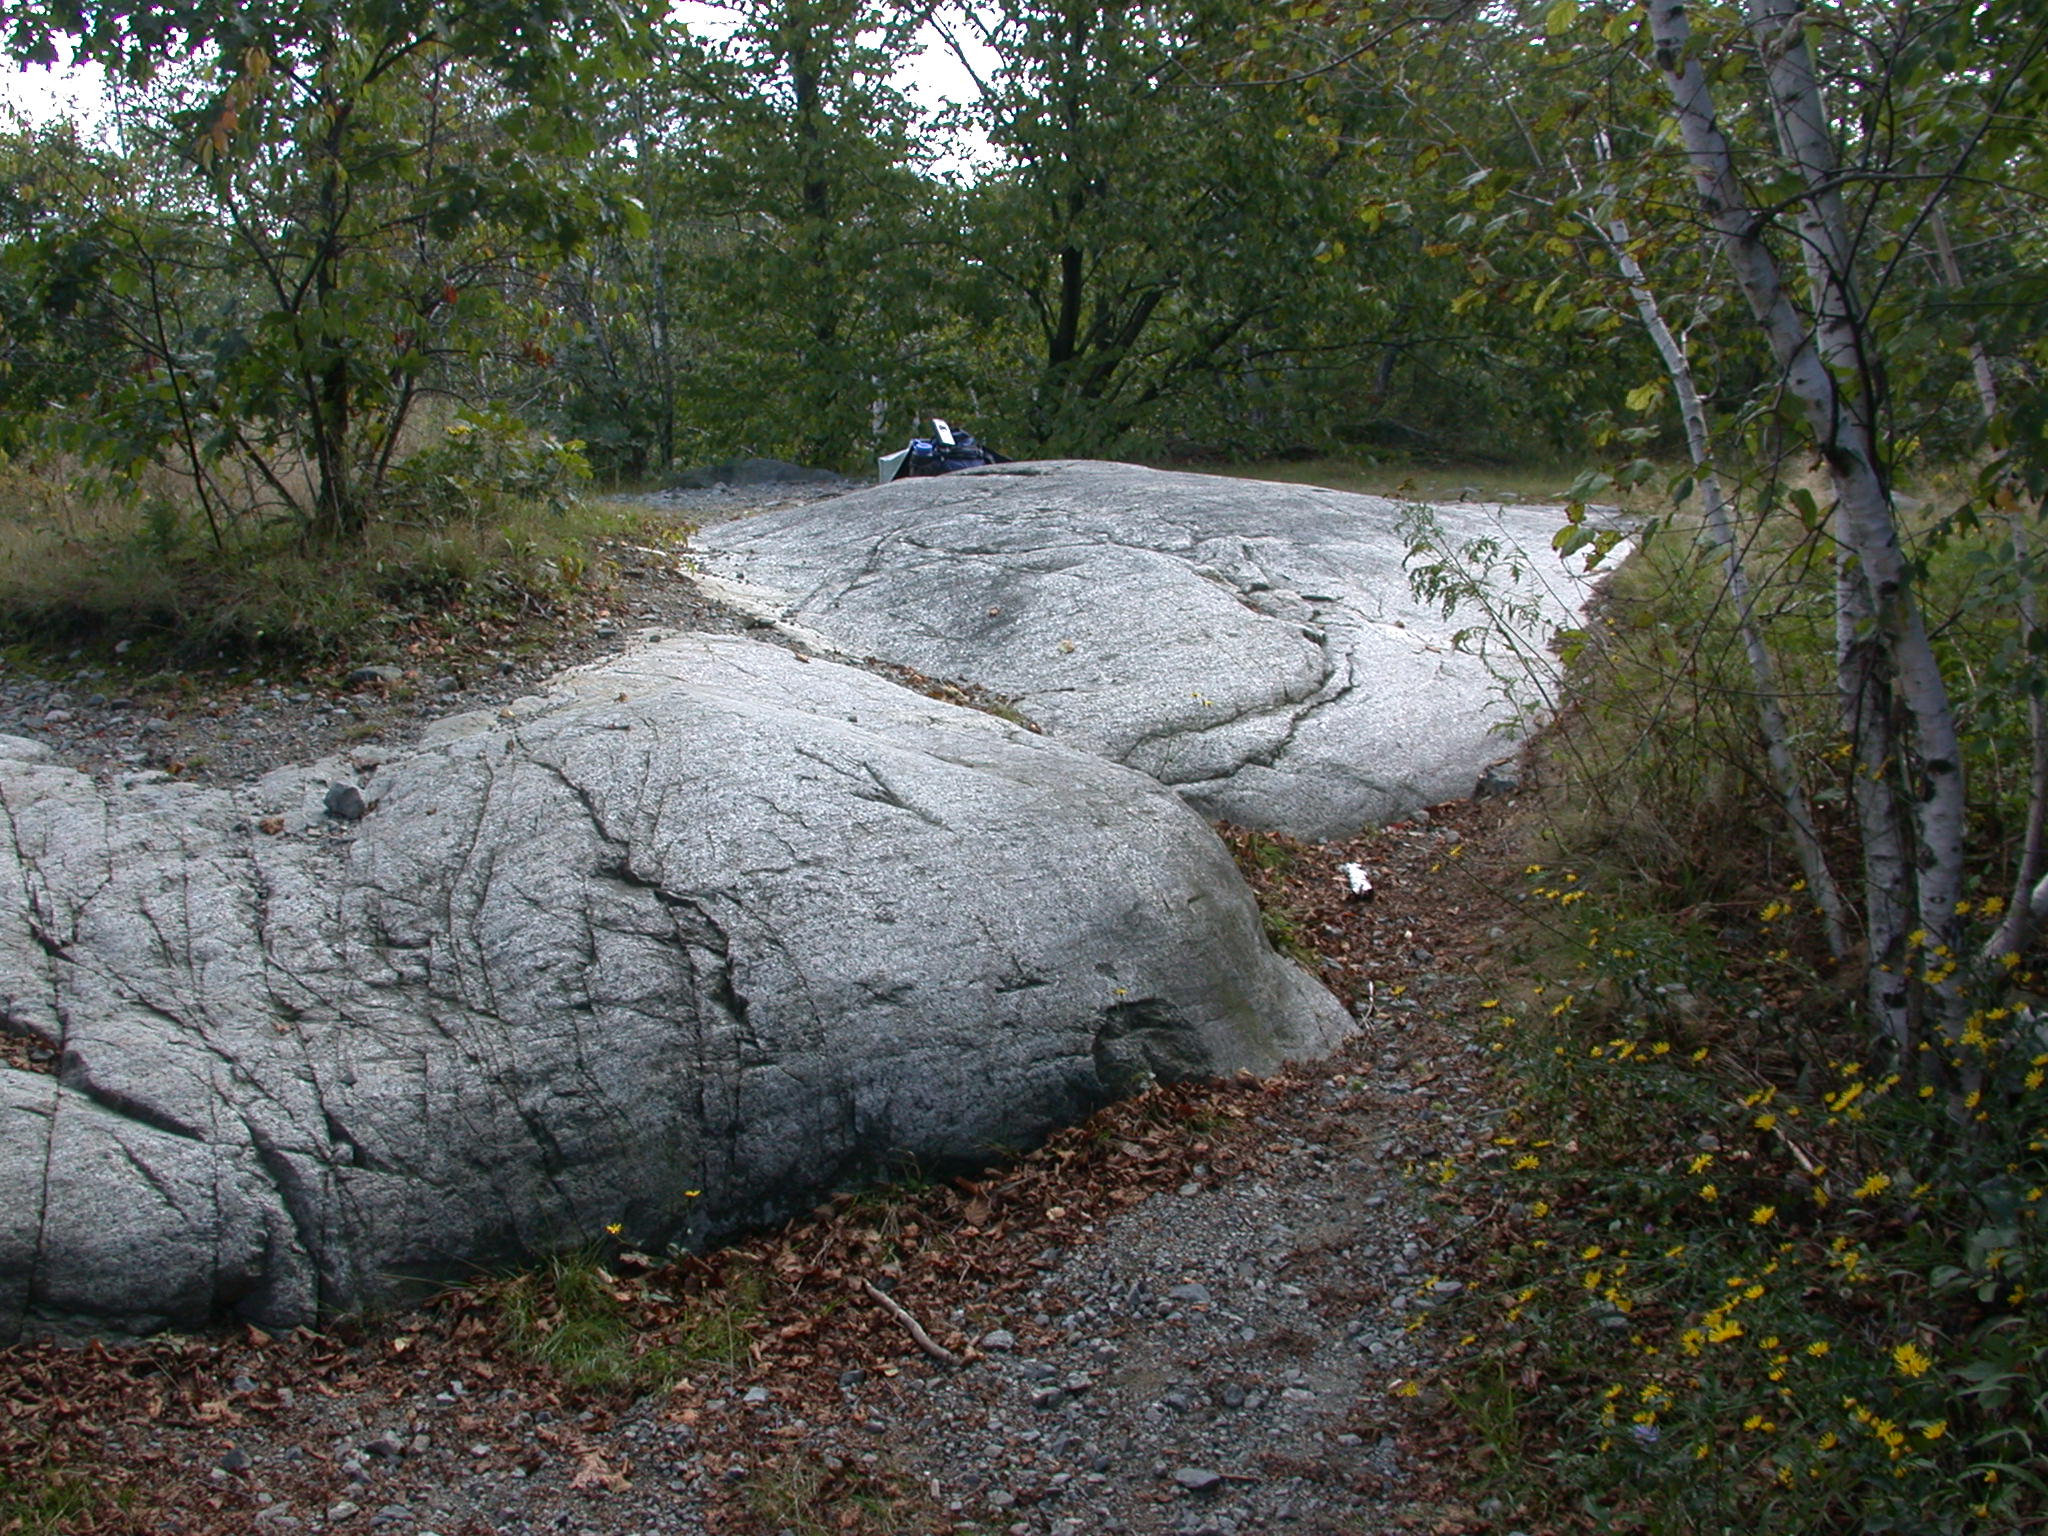
The surficial map shows all the large boulders in the Fells that might be sampled for this type of analysis (see an example below). Some boulders are better than others. A boulder cannot have moved or been broken or deeply weathered since the ice sheet receded, or the accumulation of isotopes will be interrupted. My working hypothesis is that the area was deglaciated about 17,000 years ago.
Modern Mapping Tools: Mapping in the Fells has been done in much more detail than is normal for geologic maps. Mapping in the field was at a resolution of 2 meters and the surficial map, when printed at 100%, is compiled at 1:5000. (This is just the largest scale that will fit the east-west dimensions of the map on a 44-inch plotter.) Most geologic maps in the U.S. are published at 1:24,000. I felt that the geology had much more to offer at a large scale, and with modern GPS (Global Positioning System) and GIS (Geographic Information System) technologies, and LiDAR (Light Detection and Ranging) imagery, this is all possible. The beginning pages of the full map explanation (link above) will give you all the information you need on how the area was mapped, especially if you are a GIS nerd. For his patience in guiding me through the mine field of GIS, my former colleague at Tufts, Jacob Benner (now at Univ. Tennessee, Knoxville), has my everlasting gratitude. Thanks Jake!!
What is New and Interesting on the Map? In making this map there were no big surprises in the surficial geology. Most of the area has bedrock exposure and this does not usually lend itself to an interesting glacial history other than being able to determine ice flow direction from striations. Ice striations are abundant! There are a few other things that are interesting and are worth noting:
1. From west to east across the Fells one sees a slight difference in striation directions. Overall, striations trend to the south-southeast (see example below) but they are slightly more southerly on the west side of the Fells and slightly more easterly on the east side with a slight divergence of ice flow, or a lobate pattern.
2. Almost all striations follow the regional pattern of flow to the south-southeast, but on at least two hilltops is the preservation of striations with a southeast to east-southeast direction that may be from an earlier more easterly ice flow by the last ice sheet or perhaps ice flow from an earlier glaciation. That event occurred prior to about 140,000 years ago!
3. End moraines, deposits left at the margin of the receding glacier (piles of dirt!), were found in the Fells. These deposits are not well preserved and are small, but they may be the eastern extension of more continuous ice-marginal deposits at the Mystic Lakes and an end moraine in the Fresh Pond area of Cambridge. The end moraines in the Fells were largely cut apart by meltwater escaping to the south as ice receded.
4. Across the Fells there are very large glacially transported boulders (see an example below), some perched on hilltops and at cliffs. Very few of these boulders are from outside the Fells and most of them are not technically glacial erratics. An erratic is a boulder found in a bedrock area different from itself, but most Fells boulders are on the rock formation from which they are derived. Nonetheless, their glacial transport is still impressive.

5. South of Spot Pond is an area that has some very large glacially transported granodiorite boulders, several in excess of 5 meters in diameter. In a few places these boulders line up parallel to the ice flow direction in the area and they can be traced back to a single ledge or escarpment from which they were derived.
6. Perhaps the most perplexing set of features in the Fells occurs near Sheepfold west of Spot Pond. Here there is a very smooth till surface, which by itself is unusual in the Fells. This surface has a sequence of regularly spaced ridges that resemble annual end moraines as occur further north along the coast of New Hampshire and Maine. These ridges are extremely subtle and have not been discernable in the field but instead show up on the LiDAR image base map. Without LiDAR they would not have been discovered. These ridges have a spacing (36 m in the direction of ice flow) suggestive of annual moraines, but they may also be regularly spaced subglacial till mounds. Their origin remains uncertain.

A Map in Progress: I am constantly refining the map and some interpretations could be revised as I gather new information, especially south and east of the Fells. For the most part, however, the most important field relationships seem to be worked out.
Please enjoy the Fells surficial map!
Jack Ridge