As I sit at home writing what will (hopefully) be my very first first-author manuscript, I began to wonder how scientists go about making their figures for a paper. Like many things in academia, it was probably going to be lab-specific: someone would have started using a particular software, taught the next graduate student how to use it before they left, and that student would teach the next. And so on, and so forth.
With this in mind, I took to Twitter to ask students (and @AcademicChatter), how, exactly, were they figuring?

BioRender (@vanesque89, @Nicole_Paulk)

Price: Free for personal/educational (limited) use, various paid plans
Platform: Web-based
Think of BioRender as your scientific clip-art library. BioRender has a collection of over 20,000 different icons covering more than 30 fields of the life sciences. The colors of each icon can be customized, and the drag-and-drop functionality makes figure creation very quick. Even better, there’s nothing to download! It’s right there in your browser, ready whenever and wherever you are working.
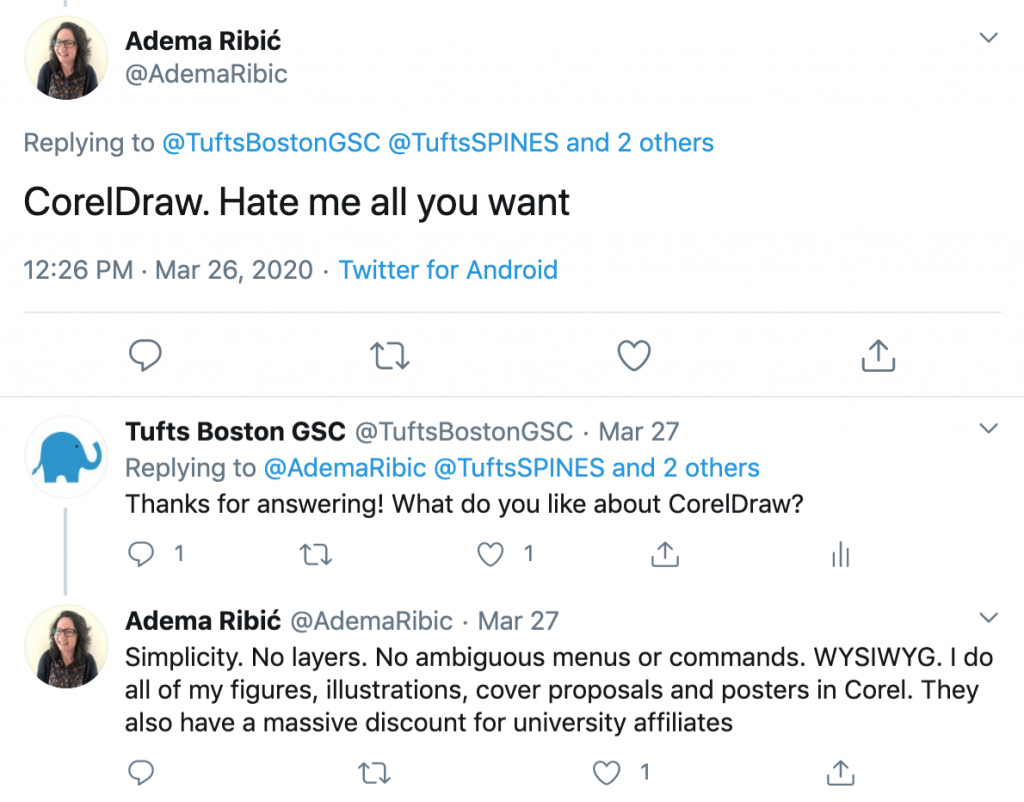
CorelDraw (@AdemaRibic)

Price: $249/year or $499 (one-time purchase)*
Platform: Windows, Mac
Originating in Ottawa, Canada, CorelDRAW touts vector illustration, layout, photo editing, and typography tools. It works on both Windows and MacOS.
*Editor’s note: Corel Education Edition is a one-time payment of $109 (thanks to Adema Ribić for this correction!)
Adobe Photoshop and Illustrator (@Nicole_Paulk)

Price: $20/month for the first year, $30/month after that (student pricing, includes all Adobe apps)
Platform: Windows, Mac, some apps available for iOS and Android
Almost everyone is familiar, at this point, with Adobe Creative Cloud, Adobe’s suite of software for designing things (literally, any and all of the things). Photoshop is useful for raw images (such as overlaying fluorescent images and stitching together microscope images). Illustrator, in contrast, is for creating vector art and illustrations, but it’s also useful for aligning the different panels for a cohesive figure. The most updated version of Illustrator seems to have kept this in mind: the Adobe website specifically mentions its use in making infographics, including the ability to edit data through a charts function.
GraphPad Prism
Price: $108/year (student pricing)
Platform: Windows, Mac
Prism is less for making figures and more for making graphs, but it’s worth mentioning here since many of us include graphs in our figures. In Prism 8, you can draw lines or brackets on graphs to indicate significance. A centered text box is automatically included for your asterisks! These graphs can be exported as images and then arranged easily in another application as panels of a figure.
Affinity Photo and Designer (@SimonWad)
Price: $50 per app, one-time purchase
Platform: Windows, Mac, iPad
These are popular alternatives to Adobe Photoshop and Illustrator. One of the major complaints about Adobe was its movement to a cloud-based subscription model. Affinity uses a one-time purchase model, and is also considerably more affordable. The company also has an alternative to Adobe InDesign (called Publisher).
This is by no means an exhaustive list of all the possible software you could use to make a figure. Many people swear by PowerPoint as their favorite way of assembling figures. Here are a few other pieces of software to check out that are free to all:
Gimp
Price: Free!
Platform: Windows, Mac, Linux
Gimp is a high-quality raster image editor. Think of this as the free version of Photoshop. It can do a lot of the same things, but it’s missing some of the advanced tools, such as using adjustment layers to non-destructively edit images.
Inkscape
Price: Free!
Platform: Windows, Mac, Linux
Inkscape is a vector graphics editor with shapes, layers, text on paths, and the ability to align and distribute objects. If you’re looking for something like Illustrator to handle vector graphics but don’t want to shell out the money, this is a great option!
Scribus
Price: Free!
Platform: Windows, Mac, Linux
Scribus is an open-source alternative to Adobe InDesign. It has many of the same features as InDesign, but unfortunately can’t open InDesign files.
Thank you to everyone who responded, and happy figuring!
Cover image by Mudassar Iqbal from Pixabay
Sources:
biorender.com
coreldraw.com
adobe.com/products/photoshop.html
adobe.com/products/illustrator.html
graphpad.com
affinity.serif.com
products.office.com
gimp.org
digitaltrends.com/photography/gimp-vs-photoshop/
inkscape.org
scribus.net


Very useful article, excellent that you wrote point by point. I want to try this soon. Thank you for sharing your experience and the experience of your students!
Hi Judith and readers,
I stumbled across this and wanted to let you know that the Affinity design apps are now available via the Tufts VDI (for anyone not familiar, google “Tufts virtual desktop” to find login instructions).
For anyone wanting to learn to use Affinity or Adobe products, feel free to ask at the Digital Design Studio at Tisch Library. While we primarily serve AS&E, we’re available for all campuses. Our Studio Assistants are now available for remote support – you can chat with them at go.tufts.edu/dds.
Let me know if you have any questions!
Kylie Terra
Digital Media Specialist, Tisch Library, Tufts
Tufts should get a Biorender license!