Tag Archives: Techniques

Top Techniques: Single-Cell RNA Sequencing

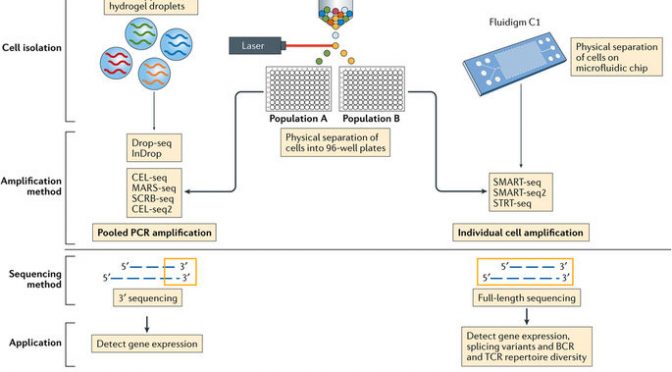
Image from Papalexi E & Satija R, Single-cell RNA sequencing to explore immune cell heterogeneity. Nat Rev Immun (2017).

As scientists ask increasingly focused and nuanced questions regarding cellular biology, the technology required to answer such questions must also become more focused and nuanced. In the last decade, we have already seen several significant paradigm shifts in how to process data in a high-throughput manner, especially for genomic and transcriptomic analyses. Microarrays gave way to next-generation sequencing, and now next-generation sequencing has moved past bulk sample analysis and onto a new frontier: single cell RNA sequencing (scRNA-Seq). First published in 2009, this technique has gained increasing traction in the last three years due to increased accessibility and decreased cost.

So, what is scRNA-Seq?

As the name suggests, this technique obtains gene expression profiles of individual cells for analysis, as opposed to comparing averaged gene expression signals between bulk samples of cells.  

When and/or why should I use scRNA-Seq compared to bulk RNA-Seq? What are its advantages and disadvantages?

The ability to examine transcriptional changes between individual cells uniquely allows researchers to define rare cell populations, to identify heterogeneity within cell populations, to investigate cell population dynamics in depth over time, or to interrogate nuances of cell signaling pathways—all at high resolution. The increased specificity and subtlety given by single-cell sequencing data benefits, for example, developmental biologists who seek to elucidate cell lineage dynamics of organ formation and function, or cancer biologists who may be searching for rare stem cell populations within tumor samples.

Practically, scRNA-Seq often requires far less input material than traditional bulk RNA-Seq (~103-104 cells per biological sample, on average). The trade-off for this downsizing advantage, however, is because of the lower input, there is often more noise in the output data that requires additional filtering. Also, as with any rising star high-throughput technique, standardized pipelines for bioinformatics processing of the raw output data are still being finalized and formalized. As the same type of growing pains occurred when bulk RNA-Seq rose to prominence, no doubt a more final consensus will also eventually be reached for scRNA-Seq.

What platforms are used for scRNA-Seq?  

The three most current and common workflows to isolate single cells for sequencing are by microplates, microfluidics, or droplets.

Microplate-based single cell isolation is carried out by laser capture of cells, for example by FACS, into wells of microplates. This approach is useful if there are known surface markers that can be used to separate cell populations of interest. It also provides the opportunity to image the plate and ensure that enough cells were isolated and that it was truly a single cell isolation. Reagents for lysing, reverse transcribing, and preparing libraries are then added to individual wells to prepare samples for sequencing.   

Microfluidics-based single cell isolation consists of a chip with a maze of miniature lanes that contain traps, which each catch a single cell as the bulk cell mixture is flowed through. Once cells are caught within the traps, reagents for each step of the sample preparation process (lysis, reverse transcription, library preparation) are flowed through the chip lanes, pushing the cell contents and subsequent intermediate materials into various chambers for preparation, followed by harvesting the final material for sequencing.

Droplet-based single cell isolation also uses microfluidics but instead of traps it involves encapsulating, within a single droplet of lysis buffer, (1) a single cell and (2) a bead linked to microparticles, which are the reagents necessary for sample preparation. The advantage of this approach is that a barcode can be assigned to the microparticles on each bead, and thus all transcripts from a single cell will be marked with the same barcode. This aspect allows pooling of prepared samples for sequencing (decreasing cost) as the cell-specific barcodes then can be used to map transcripts back to their cell of origin.

The other significant consideration for designing scRNA-Seq experiments is what sequencing method to use. Full-length sequencing provides read coverage of entire transcripts, whereas tag-based sequencing involves capture of only one end of transcripts. While the former approach allows for improved mapping ability and isoform expression analyses, the latter allows for addition of short barcodes (Unique Molecular Identifiers, UMIs) onto transcripts that assist in reducing noise and bias during data processing.    

So, which platform should­ I use?

As with most advanced techniques, determining which platform to use depends on the biological question being asked. A microplate-based platform does not accommodate high throughput analyses but does allow for specificity in what types of cells are being analyzed. So, for example, it would be a good choice for investigating gene expression changes within a rare population of cells. It also does not require particularly specialized equipment (beyond a FACS machine) and thus is a relevant choice for researchers without access to more sophisticated options. Microfluidics-based platforms are capable of more throughput than microplate-based while retaining sensitivity, but they are more expensive. Finally, droplet-based platforms provide the greatest amount of throughput but are not as sensitive. Thus, they are most appropriate for elucidating cell population composition and/or dynamics within complex tissues.

How can my scRNA-Seq data be processed, and is it different than bulk mRNA-Seq data processing?

Performing computational analysis on scRNA-Seq data follows a similar pipeline as bulk RNA-Seq, though there are specific considerations required for scRNA-Seq data processing, especially during later stages of the pipeline. One of the major considerations is significant cell-to-cell discrepancies in expression values for individual genes. This effect occurs because each cell represents a unique sequencing library, which introduces additional technical error that could confound results when comparing cell-specific (and therefore library-specific) results. This effect can be mitigated during data processing by additional normalization and correction steps, which are included in most of the publicly available scRNA-Seq processing pipelines.

Finally, the types of interpretations drawn from scRNA-Seq experiments are also technique-specific and question-dependent. Common analyses of scRNA-Seq data include clustering, psuedotime, and differential expression. While clustering is done with bulk RNA-Seq data, clustering scRNA-Seq data allows for assessing relationships between cell populations at higher resolution. This aspect is advantageous for investigating complex tissues—such as the brain—as well as for identifying rare cell populations. Given the large sizes of scRNA-Seq data sets, performing clustering of scRNA-Seq often requires dimensionality reduction (i.e. PCA or t-SNE) to make the data less noisy as well as easier to visualize. By coupling clustering results along with differential expression data, identifying gene markers for novel or rare populations is made easier. Psuedotime analysis is particularly useful for scRNA-Seq experiments investigating stages of differentiation within a tissue. Using statistical modeling paired with data reflecting a time course (for example, various developmental stages of a tissue), this analytical method tracks the transcriptional evolution of each cell and computationally orders them into a timeline of sorts, thus providing information relevant for determining lineages and differentiation states of cells in greater detail.  

Where can I do scRNA-Seq in Boston?  

Tufts Genomics Core here at Sackler has a Fluidigm C1 machine (microfluidics). Harvard Medical School (HMS) has several options for single-cell sequencing platforms. HMS Biopolymers Core also has a Fluidigm C1 system that is available for use on a for-fee, self-serve basis after training, with reagents purchased and samples prepared by the individual, as well as a 10X machine (droplet). HMS Single-Cell Core has a inDrop machine (droplet) that includes for-fee full service with faculty consultation.

What is the future for scRNA-Seq?

Bettering the way in which samples are processed and data is analyzed is a priority for scRNA-Seq experts. Specifically, ongoing work seeks to improve library preparation and sequencing efficiency. The programs used to process scRNA-Seq data are also still in flux so as to provide better normalization and correction tools for increasingly accurate data. On a larger scale, developing technology to analyze other biological aspects (genomics, epigenomics, transcriptomics) at the single cell level is of high interest, especially when considering how powerful combining these other forms of single-cell analysis with transcriptomics could be for understanding both normal and disease biology.

Resources:

  1. scRNA-Seq software packages: https://github.com/seandavi/awesome-single-cell
  2. Review of bioinformatics and computational aspects of scRNA_Seq: https://www.frontiersin.org/articles/10.3389/fgene.2016.00163/full
  3. Practical technique review: https://genomemedicine.biomedcentral.com/articles/10.1186/s13073-017-0467-4
  4. Start-to-finish detailed instructions on scRNA-Seq: https://hemberg-lab.github.io/scRNA.seq.course/biological-analysis.html

Top Techniques: So you want to study metabolism…

Written by Daniel Fritz and Judi Hollander


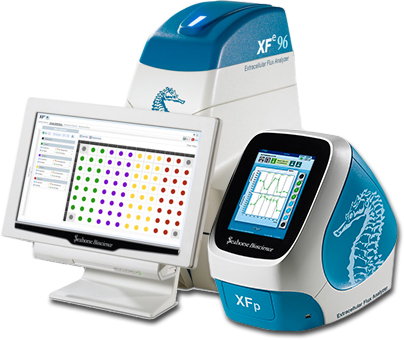
When studying the phenotype of a particular cell line or observing changes after cell treatment it is often desirable to establish the relative contributions of various metabolic pathways.  Agilent’s (formerly Seahorse Bioscience’s) Seahorse XF Analyzer fulfills the role of a capable, easy-to-use platform to gather important bioenergetic data, all in real time.  While this instrument has been around for roughly ten years, it had been relegated to niche fields and saw relatively little exposure.  In fact, many of you may not be aware that Tufts recently purchased one (a Seahorse XFe96, in case you were wondering)!  With more labs and fields now considering the details of cell metabolism within the framework of their research, the Seahorse XF Analyzer (or “Seahorse”, for short) has become something of a gold standard when discussing cellular metabolism profiles and nutrient preference.  With the addition of a Seahorse analyzer to Sackler, now is as good a time as any to consider adding this instrument to your toolbox.

At this point you may be thinking, “Dan, Judi, this all sounds great, but what exactly does it do?” Good question!  Let’s discuss what exactly the Seahorse XF Analyzer measures and how it does so.  Principally, the Seahorse investigates the balance of mitochondrial oxidative phosphorylation and glycolysis within a population of cells.  The instrument is loaded with a stacked double plate.  The lower plate is a relatively simple multi-well plate that the researcher seeds with the cells of study.  The cells form a monolayer along the bottom with a small volume of media on top.  The upper plate consists of probes for each well and four small-volume drug ports per well where the researcher can preload the compounds of interest in order to test the cells’ metabolic response.  The instrument is programmed to inject specific drug ports at precise times and the well-specific probes are lowered into the media to form a microchamber where pH and oxygen level within the media can be measured.  Changes in pH and oxygen level are a consequence of the cells undergoing metabolic processes in response to the drug treatment.  The analyzer can then calculate the rate of change in these parameters, resulting in Extracellular Acidification Rate (ECAR) and Oxygen Consumption Rate (OCR), respectively. These parameters are indicative of how fast glycolysis and mitochondrial oxidative phosphorylation metabolic pathways are working.

With Seahorse, the most important part of your assay will be determining what question you want to ask.  Because of its sensitivity and capabilities, it is very easy to get lost in the amount of data you are collecting.  To aid you in your research, Agilent has a variety of kits available that can answer common questions, and their representatives are more than happy to work with you to develop a custom assay to fit your needs.  Each kit supplies a pre-measured amount of certain drugs, which are injected into wells during the assay.

Questions Assay
  • Are my cells undergoing a metabolic switch?
  • How much proton efflux is due to glycolysis?
Glycolytic Rate Assay
  • How are key mitochondrial parameters changing in my cells?
Cell Mito Stress Test
  • What is the baseline metabolic phenotype of my cells?
  • What is the metabolic potential of my cells?
Cell Energy Phenotype Test
  • What type of fuel (glucose, glutamine, fatty acids) is preferred by my cells?
  • How flexible are my cells toward using other fuels when the preferred fuel is unavailable?
Mito Fuel Flex Test
  • How capable are my cells of using glycolysis when oxidative phosphorylation is blocked?
Glycolysis Stress Test

Additional information can be found at Agilent’s site: http://www.agilent.com/en-us/products/cell-analysis-(seahorse)/seahorse-analyzers?sh_0015

Top Techniques: NMR

What is NMR?
Nuclear magnetic resonance spectroscopy, or NMR spectroscopy, is a powerful technique that uses the magnetic properties of atomic nuclei to elucidate the chemical and physical properties of the atom or its molecule. The nuclei of certain atoms, such as 1H or 13C, align themselves with magnetic fields in nuclear energy levels known as ‘spin states.’ When molecules are placed in an external magnetic field and irradiated with radiofrequency (RF) waves, certain atomic nuclei present in the sample absorb energy. These RF waves flip nuclei from one spin state to another. If the RF is turned off, the nuclei relax, releasing energy in the form of RF waves, which are measured as the decay in signal intensity over the course of a few seconds. The time domain of these signals is converted to the frequency domain to produce a spectrum, what we normally think of as the output of an NMR experiment.

But what can you actually do with NMR? Traditionally, the technique has been used to identify molecules and determine their 3D structures. It can certainly do this; however, the actual range of applications for this technique is much wider. With metabolomics approaches, you can quantify biofluids and tumor and tissue extracts. Binding events, even very weak ones, between two proteins or between protein and DNA can be detected. You can also determine the stoichiometry of these binding events. Trying to compare a wild-type protein to its mutant variant? Characterizing the active site of your protein of interest? NMR can handle both of these tasks, and measure dynamics of the protein in its active conformation as well. To that end, NMR can also be used in live-animal imaging. If you’ve ever had an MRI, you may know that the technique is actually based on the science of NMR!

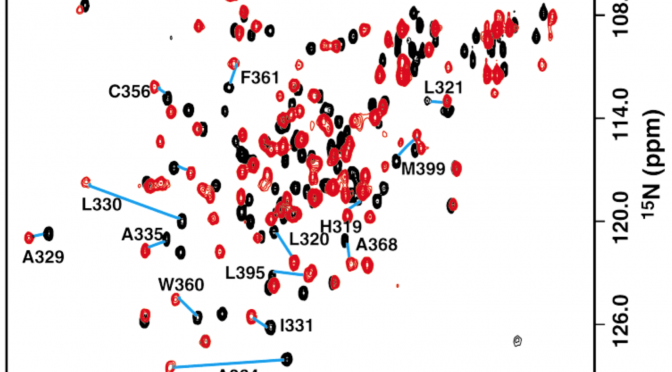
Figure 1. 1H-15N 2D spectrum of BPV-1 E2 DBD (310-410). Resonances of the DNA-bound protein (red) show chemical shift differences relative to the DNA-free sample (black) (taken from Veeraraghavan et al. Biochemistry (1999) 38: 16115-16124).

What facilities does Tufts have for NMR spectroscopy?
The Tufts NMR Center currently has 3 NMR spectrometers, all located in an environmentally controlled laboratory on the 6th floor of M&V.

The Bruker DRX-600 spectrometer used for structure determination of large protein domains and small proteins, as well as metabolomics experiments. It offers the highest resolution and sensitivity of the three instruments.

The Bruker AMX-500 spectrometer is good for examining peptides and small protein domains.

The Bruker DPX-300 spectrometer is useful if you need to check the identify or purity of products of organic synthesis. The system is set up to look at nonstandard nuclei, such as 11B.

The NMR Center is also in the process of upgrading the Bruker DRX-600 by replacing the console electronics. With this upgrade, features such as non-uniform sampling and cryogenic cooling, which can double the sensitivity of 2D and 3D experiments. Other upgrades to the hardware will increase the reliability, ease of use, and speed of data collection for this system. Users will be able to study the structure and dynamics of proteins and protein complexes with high molecular weights and limited solubility, which is limited by the current sensitivity of the instrument.

Information about the spectrometers available in the NMR Center can be found at the following website: http://medicine.tufts.edu/Faculty-and-Research/Core-Research-Facilities/Tufts-NMR-Center. With questions or for help planning an NMR experiment, please email Dr. Jim Baleja at Jim.Baleja@tufts.edu.

If you are interested in reading more about NMR spectroscopy, Bothwell and Griffin wrote a straightforward but in-depth article (Biological Reviews (2011) 86: 493-510).

Top Techniques: The Basics

Western Blot

PCR

IHC

Immunoprecipitation

Top Techniques: Confocal Microscopy

by Alenka Lovy

What is confocal microscopy?

Reading and thinking about cell biology is very interesting no doubt, but I find that to be able to see biological processes by live microscopy just amplifies the questions at hand so much! Have you ever seen movies of cells dividing? I remember when I first did. It was hard to go from the picture perfect diagrams of the textbook to the real thing, but after a few times of watching the movies I saw the perfect (or not so perfect) progression through all the steps. Maybe it was the timing of it, or just being able to see the tangle of chromosomes trying to line up, and then the sudden division, I found it so breathtaking! Live cell microscopy has been my tool of preference to answer many biological research questions ever since.

Confocal microscopes in particular are powerful because they optically slice through a specimen (even live cells) and allow 3D image reconstruction in up to four different fluorescent channels. Confocals are built to scan point by point through your sample using laser light, and image just one particular plane of focus. This is very different to the standard fluorescent microscope which illuminates and images the entire sample at once, including out-of-focus light. The confocal is used to obtain clearer images of subcellular details that cannot be imaged with the fluorescent microscope and is especially useful for co-localization studies. There are many exciting techniques you can use with the confocal including fluorescence recovery after photobleaching (FRAP) with which you can observe protein mobility and recovery, fluorescence resonance energy transfer (FRET) which can show protein interactions, as well as photoactivation/uncaging studies.


BOX 1: What confocal can do for you (and your mitochondria)

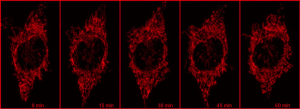
Using a photoactivatable GFP targeted to the mitochondria to measure mitochondrial fusion is a nice demonstration of the precision and quantitation that can be achieved using a confocal. Mitochondria are amazingly motile and networked and look like spaghetti . They also undergo constant fission and fusion, which can be difficult to capture. The top panel in the figure below shows the mitochondrial network (z stack) labeled with TMRE in Hela cells imaged every 15 min for 1 hr. It is impossible to capture which mitochondria are fusing.

red

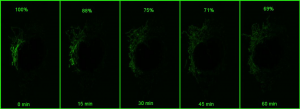
green

However, if a small portion of the network is photoactivatedand then imaged in z stacks over time, the signal can be monitored over time (bottom panel in the above figure). As the mitochondria fuse, the GFP protein becomes diluted in the larger volume of the network that has not been photoactivated, and the extent of dilution can be quantified and used as a measure of mitochondrial fusion.


What facilities does Tufts have for confocal microscopy and other imaging techniques?

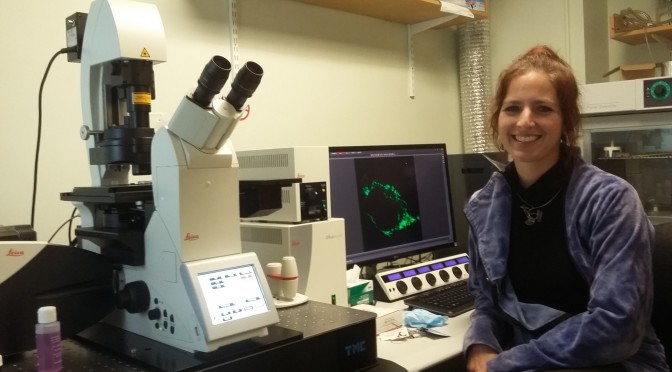
The Tufts Imaging Facility has four confocal microscopes and most are equipped with the standard 405nm, 488nm, 561nm and 633nm laser lines, which is important to know when choosing fluorophores. Using the Fluorescence SpectraViewer online will help you determine if the emission spectra of your fluorophores overlap such that crosstalk between them can be minimized. We have two inverted microscopes equipped for live cell imaging, and two upright microscopes that are usually used for fixed samples and 3D reconstructions. While imaging living cells, you can use an automated focusing mechanism which employs an infrared laser that keeps track of the coverslip, and therefore your sample. If you’ve ever had to adjust the focus yourself over several hours, you know just how powerful this feature is!

The Nikon A1R inverted confocal has a resonant scanner capable of high speed imaging (500 frames/sec at 512×512 pixel resolution) suitable for ion imaging and is being used for calcium imaging in cardiomyocytes. It also comes in handy during very long tiled scans with z-stacks, and although the image quality is slightly sacrificed, depending on the resolution needed, the gain in speed may well be worth it.

The Leica SP8 inverted confocal has a HyD sensitive detector and can be used with very low laser powers allowing longer imaging of easily bleached samples. For example, measuring how quickly a photoactivated GFP spreads within the mitochondrial network every minute over an hour would bleach the signal before all the information was collected on a regular detector compared to a HyD detector.

Another good technique to avoid bleaching in live cell imaging is to use the total internal reflection microscope (TIRFM). On this microscope, you can adjust the angle of laser light with which you illuminate your sample. There is a particular angle at which all the laser light is internally reflected, except for a 100nm evanescent wave. With this you can then image processes close to the membrane, such as receptor insertion/cycling. Very often you can image a little bit deeper than the 100nm, and because the laser is at an angle, you will not bleach your specimen as fast. As opposed to confocal, the TIRF system has a sensitive EMCCD camera, enabling faster imaging (I have been looking at calcium sparks at 50 ms/frame).

The Leica upright microscope has water immersion objectives that have a large working distance and work well for thick cleared samples such as mouse brains or zebrafish embryos.

Finally, in addition to standard fluorescent microscopes, we also have the automated Keyence fluorescence microscope which can scan up to 3 slides and stitch large images together in four channels as well as in brightfield. If large tiled scans are needed, this may be the instrument of choice due to the speed and ease of use.

For more information about the instruments in the Tufts Imaging Facility, please visit our website. If you would like to use an instrument or need help planning an experiment please email me at:

Alenka.Lovy@tufts.edu.

If you’d like to learn more about microscopy in general, the Molecular Expressions Microscopy Primer is a great resource.

Techniques – Go with the Flow

What is Flow Cytometry and what can it do for you?

by Stephen Kwok & Allen Parmelee

Flow Cytometry is something I never heard about in school, but once I learned about it, the possibilities seemed endless as to how I could use it as a tool to make work and research better. FACS (Fluorescence Activated Cell Sorting) Sounds like an office tool, not a state of the art piece of scientific equipment. In reality, it is like a multitude of fluorescent microscopes all working together to gather data at the same time. Wait, it gets better…you can actually physically separate your cells from one single cell per well on a 96 well plate, to millions of cells in a 15ml tube! The human eye has a habit to have bias; these machines convert the analog data into a digital plot or histogram that can’t be argued with! Is it 30% positive or 35% positive? Yes, we can actually tell the difference!

Let’s back up a step here. The technology is best used if you have markers for your cells. You can take fluorescently labeled antiboties to identify cells. Let’s say you are looking for stem cells. Cd34, SCA-1, and c-Kit are common for hematopoietic stem cells. Label these three, throw in a viability marker, and you have successfully identified these cells. You can move forward with your experiment and simply ANALYZE the cells. Or, you can try to isolate these cells by SORTING them. Fluorescent protein transfections with a GFP or RFP marker are common. Why grow cells in harsh selection media when you can simply pluck them out and put them into a plate? I need to do some PCR, but I have to figure out how to get 1 cell, 5 cells, 25 cells, 50 cells. Limited dilution is going to take me forever! In as fast as 30 seconds you can have those exact numbers of cells lined up into your pcr tubes or a 96 well plate.

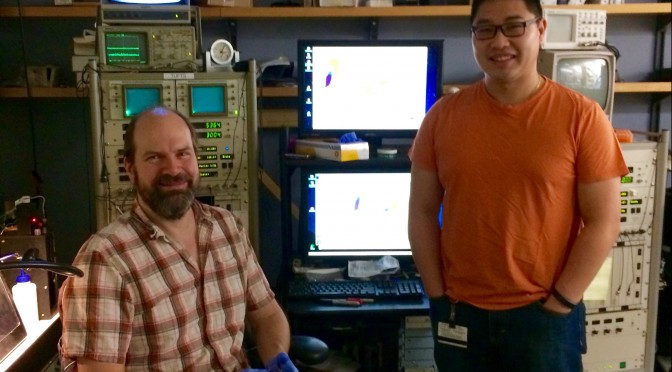
At our facility we have cell analyzers available for use 24/7. We train people in basic theory, and then help them get started on how to run the instruments. Sorting, however, is a little more complicated and is done by the two intimidating guys running the facility: Allen and Steve. 

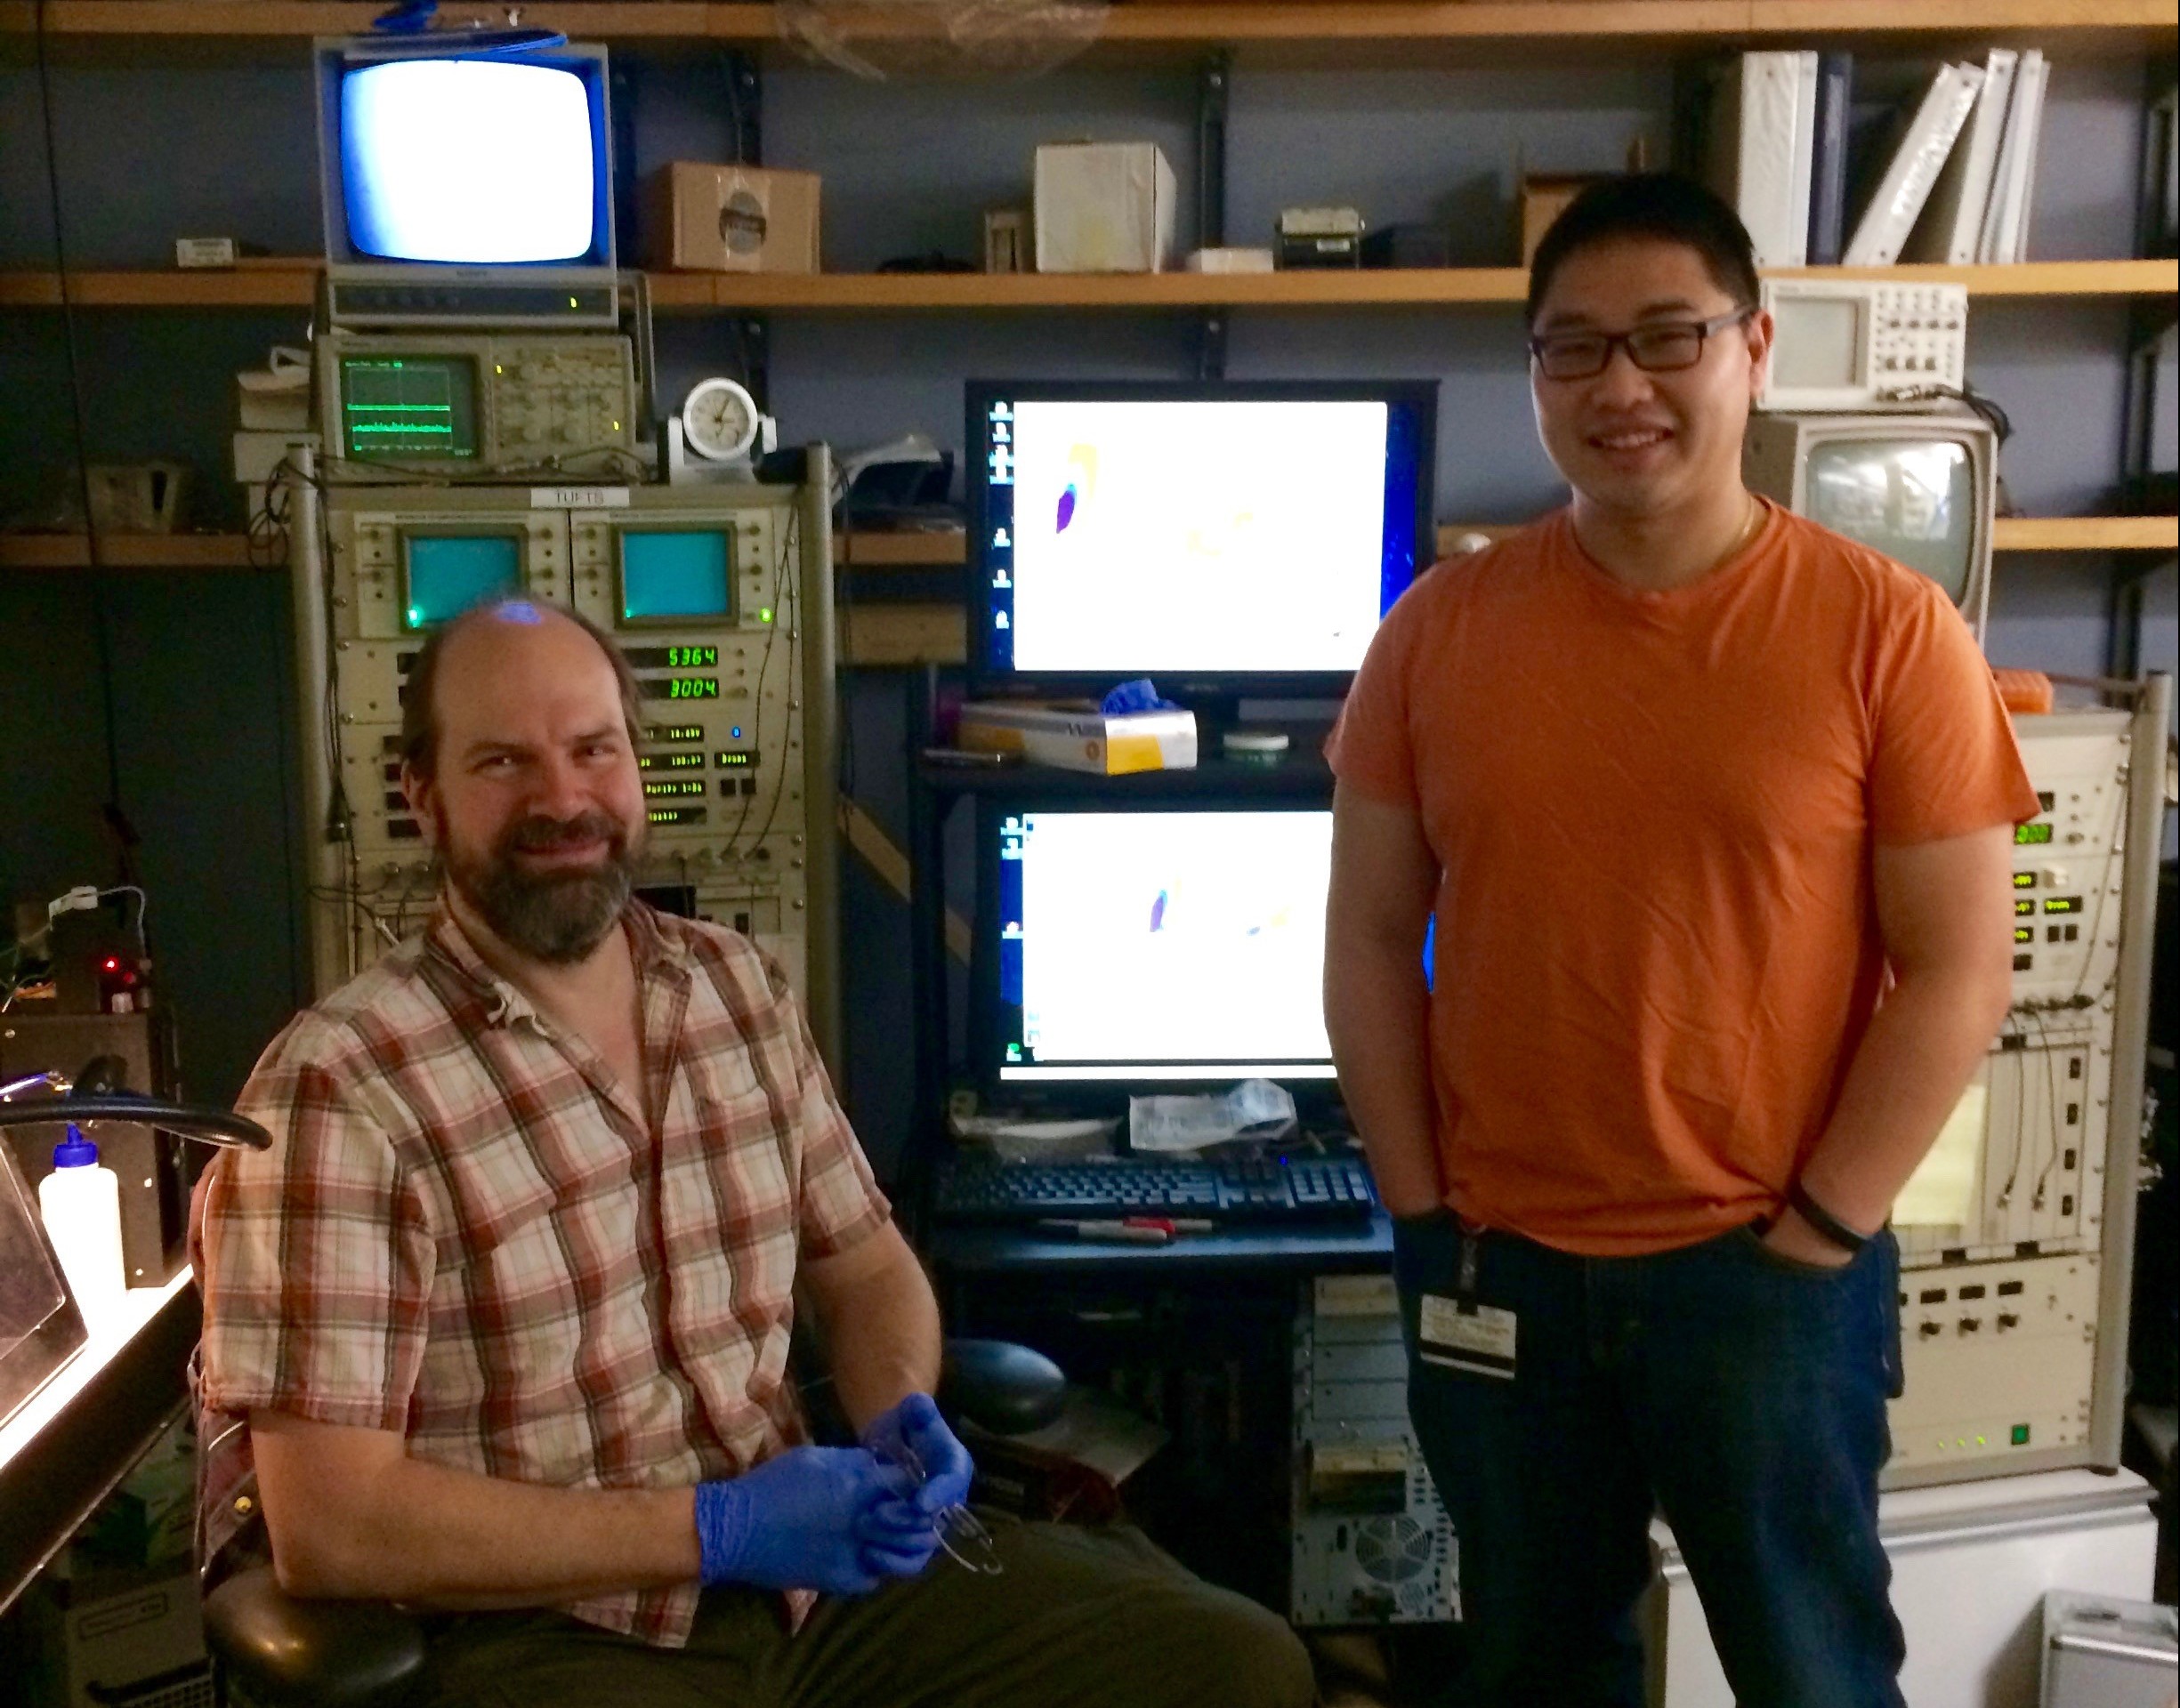
Steve & Allen, the Flow Bros (right to left)
Allen Parmelee & Stephen Kwok, the Flow bros (left to right)


There are always plenty of questions to answer about FLOW. How fast is fast? Well the Analyzers can run approximately 3,000 cells per second. The high speed cell sorters. 30,000 cells per second! This can translate to over 100e6 per hour. How sensitive are the machines? We can detect one cell in 10e6 cells! How many markers can I use? The most common is 4 different colors at a time, but we could do up to 17. Be wary, however, just because we said you can. Doesn’t mean you should. Work smarter, not harder! I have 4 different populations: can I sort them all at once? Yes! In fact, we can do up to 6 simultaneous separate populations at once.

How can I do good flow cytometry? The key is sample prep! Yes, they seem like magical boxes, but the experiment is only as good as the components. Titer your antibodies. TEST them with a positive control. Bring a negative or untreated control as a baseline. Would you run a gel without the markers? Find the correct markers, and look for the greatest separation. Cells need to be in Single Cell format. It is highly recommended to filter/strain your samples because the pathway for the cells are 70-150um in size, a clump of cells can clog the machines and render them inoperable.

Come by, check out the machines, ask us questions…we hope you’ll be pleasantly surprised at the possibilities.

Tufts Laser Cytometry, Jaharis 5th floor. 

Special points of interest:

  • No Color Cloning
  • Bulk Sorting
  • Fluorescent work
  • Cell Cycle
  • Apoptosis
  • Ca+ Flux
  • Single Cell PCR
  • Rare Event
  • Bacteria
  • CRISPR
  • Stem Cells
  • Neurons
  • Transfections
  • Infections
  •  Libraries


Techniques: How to Enjoy Holiday Vacation as a Graduate Student

This is always a busy time of year, and whether you are traveling or staying local, taking time off or continuing to work, here are some things to make this season more merry and bright:

  • Sleep. On a bed, not your lab bench or desk. Get a lot of it to catch up after committee meetings and final exams.
  • Eat. Try a new recipe at home (here are some recipes and here are some tips on cooking as a grad student) or make a list of new restaurants to taste test.
  • Travel, even for just for a day or within an unexplored neighborhood of Boston. Experiencing some place new will help shake up your routine and maybe even your perspective.
  • Reconnect with friends and family, either in Boston or at home. Knowing you have a support system can do a lot for morale, motivation, and overall wellbeing.
  • Find a new TV show to binge watch. Winding down with the latest adventure saga or drama-filled reality show can give your brain a rest, making you more alert and ready to work the next time you’re scanning PubMed or sitting down at your bench. Feel free to contact the InSight team for suggestions!
  • Wanted to try rock climbing or pottery or paint night? Now’s the time to do it! You might even be able to find some holiday deals too. For those staying local, take a walk around the Boston Common and maybe stop by the Frog Pond for skating.
  • Try experiencing science in a new and different way. As graduate students, thinking about our research isn’t something we really can never stop doing. What we can do during vacation, however, is examine it from a new angle. Look at your field from the perspective of the media, or medicine, or industry. It’ll make you feel productive while also freshening your thoughts on what you deal with on a day-to-day basis and maybe even propel you in a new direction when you return to the bench.

Happy holidays, Sackler!

Photo from www.phdcomics.com (“Piled Higher and Deeper” by Jorge Cham). 

Techniques – Wild, Wild West(erns)

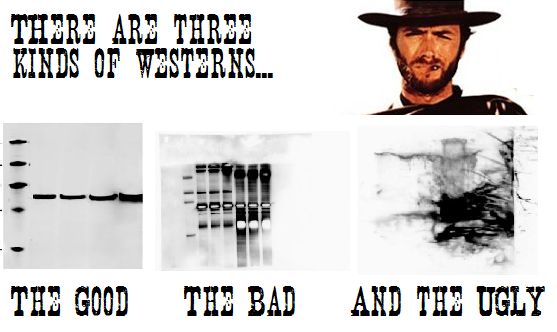
Need some help to tame that wild western blot? Here are some tips and tricks to help you along the way –

  • Always check ladder migration pattern based on specific gel and electrophoresis conditions, as these factors can shift the apparent molecular weights from the supposed “standard” ladder image given out by the company.
  • When testing a new antibody, leave the blot intact, opting to strip it and perform a control protein blot after probing for your target protein. Cutting the blot and using different pieces for your target and control protein on a first try may obscure alternative target protein isoforms or off-target background staining.
  • High background? Try a more stringent blocking condition than just BSA or milk by adding goat serum or fish gelatin to your solution. Blocking overnight also can help clean up your blots.
  • Is you gel “smiling” or “frowning”? This usually happens when your sample buffer has too much salt.
  • Make sure your PVDF membrane is pre-activated with methanol for 20 minutes before making gel sandwich. It’s also a good idea to mark which side of the membrane is facing the gel with a sharpie, on a top corner.
  • It’s always a good idea to do a Ponceau stain on your membrane after transfer to make sure your transfer went all right. Alternatively, you can also stain your gel with Coomassie blue.
  • It is possible to over-transfer, especially for low MW proteins (<10 kDa) – optimize transfer time or reduce voltage. On the other hand, high MW proteins will take longer time to transfer.
  • Have a dirty secondary? Consider adding a wee-bit of Tween-20 to your washes (0.01-0.5%).
  • When loading your samples, press on the pipet just enough to get any possible air bubbles out and run the tip through the running buffer in the tank before putting it in the well. And make sure your sample was denatured prior to running.
  • If power supply reading shows 0 when switched on, make sure your power cables are properly connected to the power supply. If that doesn’t work, check for broken electrodes or blown fuses. Lastly, try with a higher limit power supply.
  • As always, make sure you write down the protocol before-hand and check through every step when performing. This will help you track your steps back to see at which step things could have gone wrong.


Source - http://prooffreaderplus.blogspot.com/2014/05/one-of-my-favourite-memories-good-bad.html
Source – http://prooffreaderplus.blogspot.com/2014/05/one-of-my-favourite-memories-good-bad.html