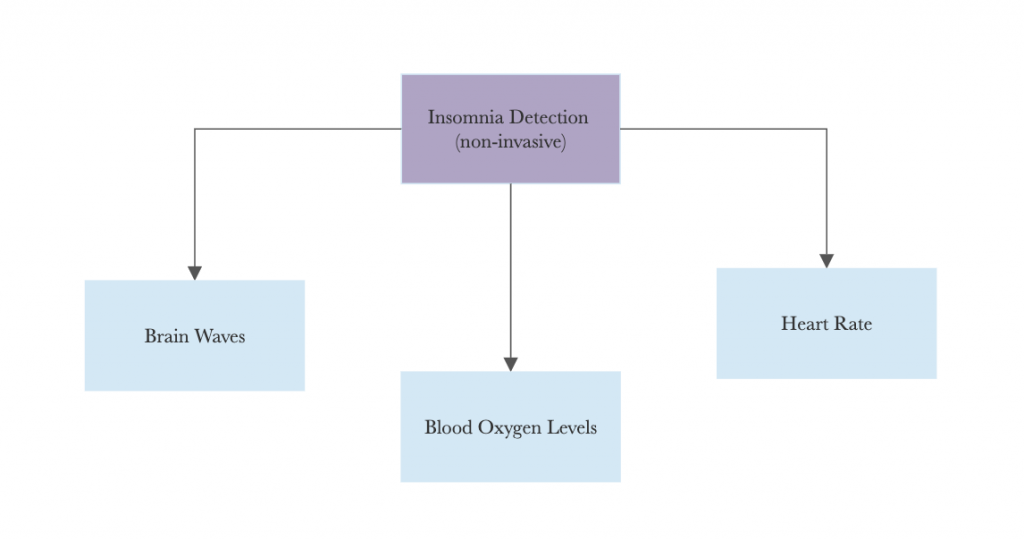
Due to the prevalence of these sleep disorders, several different techniques have been developed to study sleep. In addition to self-reporting of symptoms, processes such as polysomnography (PSG) that records important metrics as you sleep (see Figure 1), have become the gold standard in diagnosing sleep disorders such as insomnia.
This is a noninvasive process that provides a comprehensive view of sleep patterns, allowing doctors to effectively evaluate the patient’s condition. However, this method is not able to assess the root cause of these sleep disorders at a biochemical level.
Instead, researchers have developed neuroimaging techniques such as magnetic resonance spectroscopy (MRS) that allow them to measure the presence and concentration of metabolites in the brain. MRS applies a strong magnetic field to the brain of the patient. Different nuclei within the brain will produce slightly different resonance frequencies and chemical shifts when subjected to this magnetic field due to differences in their spin. As the atom transitions between high and low energy states due to this field, the energy absorbed is measured, allowing the identity of relevant compounds such as GABA to be determined. Furthermore, electron shielding effects can shift the resonance frequency up field, decreasing the chemical shift observed, providing additional information regarding the proton environment within molecules (26).

This process uses several pulses to generate a spectrum with several peaks that can be easily identified and compared against healthy patients with some studies finding patients with insomnia having almost 30% reduced GABA levels (28).

Figure 3 shows an example MRS spectrum of a brain. Despite the changes in the electron distribution being very minor, the difference in the magnetic field experienced by the nuclei of each atom will produce a different resonance frequency that is a significant enough difference to differentiate the peaks. Each compound in the brain corresponds to a very specific chemical shift that can be used to identify the presence and quantity of each compound. Figure 3 contains labels for each of these peaks and their corresponding compounds (29).
These methods have given us some insight into the biochemical causes of insomnia, but there are still some limitations to these approaches. Low sensitivity and low resolution spectra, as well as metabolite degradation can cause unreliable results to be recovered; however, this allows us to measure the important metabolites involved in insomnia with relative accuracy and ease.
Overall, I think this section is also clear and concise but lack of some details. For example, in Figure 1, three main factors to determine insomnia are brain waves, blood oxygen levels, and heart rate. However, the following paragraph discuss about MRS and metabolite concentration in the brain. I would suggest either delete Figure 1 to maintain the flow of the section or add additional paragraph to elaborate the figure.
I also think it will be imperative to include more details for figure 1.
Figure 1 and PSG are only briefly mentioned and described because the main focus of this section is MRS and how it gives a much better understanding of insomnia by measuring metabolites in the brain. Since PSG is noninvasive we wanted to just give a small description of what it would measure while not focusing on it too much.
Overall, I think this page provided clear explanations. I agree with JP, where the beginning of the paragraph after figure 1 refers to (I believe) PSG. The figure is a nice flow chart, but it feels out of place. I wouldn’t say delete the figure, but move it and probably cite it in-text to put it in context. I appreciated the explanation of the MRS spectrum as well. As a minor idea, I would personally find it cool if a couple of the major peaks were compared. As in, show a couple structures and why they have different shifts.
Quick note: I found figure 2 hilarious because it looks like the patient is being catapulted into the instrument — definitely caught me off guard
I also think comparing the peaks could be cool. But more importantly, a better concluding sentence to the last paragraph is needed.
I would adjust your wording here so eliminate use of “in figure …” statements. This does provide a nice layout of some current methods used to detect these chemical compounds in the brain. nice job!
Good work on this page. One suggestion would be to further explain the “metabolites” present in the brain. What are these metabolites and which concentrations can indicate certain issues/pathologies in sleep? Otherwise good work on this section, I like how you included the example MRS spectrum for reference.