
Visualizing Complex Functions

Tufts Math professor Moon Duchin asked me to come up with a simple way for her class to use Mathematica to visualize functions of complex variables for her Complex Analysis class.
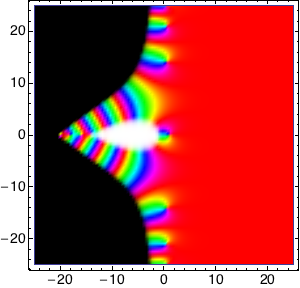
Each coordinate in the plane, can be mapped onto a complex number, e.g. (1,1) maps to 1+i. A complex function is something that takes a complex number as input and spits out another complex number as output. The Mathematica program applies a complex function to each point in the complex plane and plots a color according to the argument of the number returned.
We invite you to download the mathematica notebook to try and use yourself.
Some sample plots are displayed below.


