Data
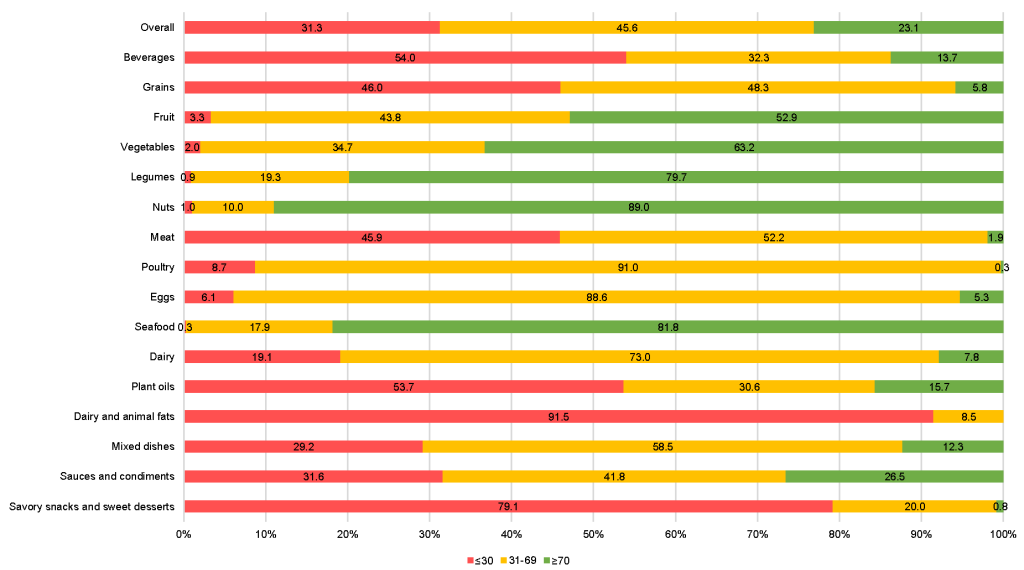
Based on observed ranges, a Food Compass Score (FCS) ≥70 was selected a reasonable cutpoint for foods or beverages to be encouraged; 31-69, to be consumed in moderation; and ≤30, to be minimized.
Percentages of FCSs ≤30, 31-69, and ≥70.

Variations in FCS across similar products
Example FCS for different types of cherries:

Example FCS for three different protein sources:

Example FCS for three different types of soup:

Example FCS for three different juice beverages:

Example FCS for three different grain-based foods:

Example FCS for three different chocolate desserts:

A total of 54 individual attributes across 9 domains are assessed per 100 kcal (418.4 kj) of food product. Beneficial attributes were scored from 0 to 10, harmful attributes scored -10 to 0, and attribute ratios (which could range from harmful to beneficial) scored -10 to 10. Each domain receives a score as the average of all attributes in that domain. Food ingredients are scored as the sum, as contents of ingredients are interdependent. The final Food Compass score (FCS) is scaled across all food and beverage items to range from 1 (least healthful) to 100 (most healthful).
Testing and Validation
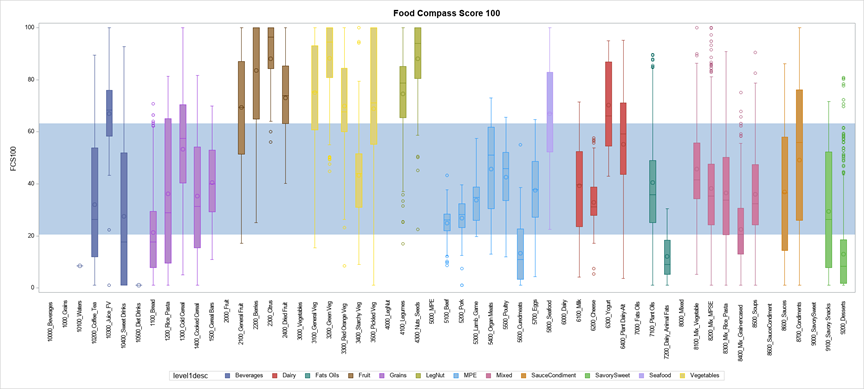
The Food Compass algorithm was developed based on assessment of more than 100 reported food rating systems.4,9 Food Compass was then applied to all 8,032 unique foods and beverages in USDA’s Food and Nutrient Database for Dietary Studies (FNDDS) to assess usefulness and validity. Based on observed ranges, a FCS of 70 or higher was selected a reasonable cutpoint for foods or beverages to be encouraged; FCS between 31 to 69 is for foods or beverages to be consumed in moderation; and a FCS less than 30 are for foods and beverages to be minimized. A figure depicting Food Compass Score (FCS) for 8,032 unique foods and beverages consumed by U.S. Adults, based on NHANES 2015-16 can be seen below as standard boxplots, comparing the scores between 12 major food categories (top panel) and 44 food subcategories (bottom panel). The horizontal lines representing the median FCS score; shaded bars, the interquartile range (25th, 75th percentiles); error bars, the 5th and 95th percentiles, and small circles, additional outliers.


Food Compass vs. Other NPS
Food Compass and the NOVA classification system
Discriminant potential of FCS was evaluated within each category of the NOVA classification system. Within each NOVA category, food items had relatively broad ranges of scores. Unprocessed items (NOVA=1) generally scored as healthier (mean FCS~82) than ultraprocessed items (NOVA=4, mean FCS~37).
Food Compass vs. Health Star Rating (HSR) and Nutri-Score
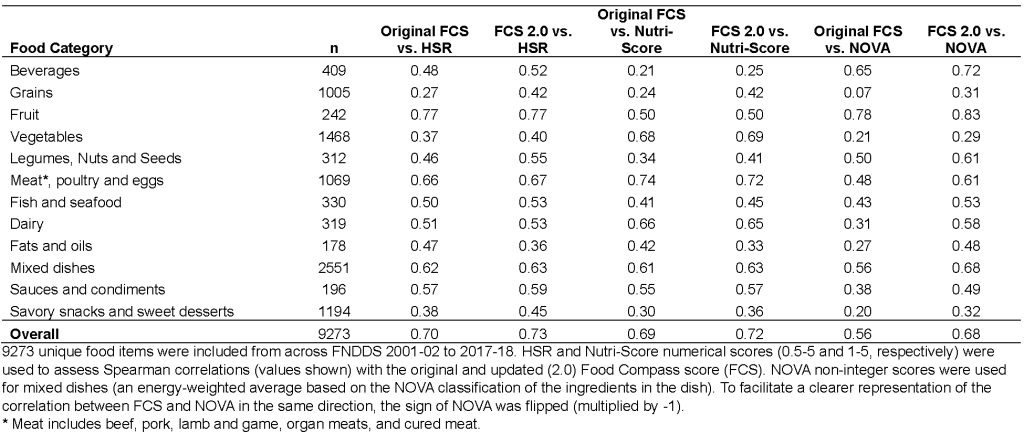
Health Star Rating (HSR) and Nutri-Score were designed for packaged foods, not home-cooked foods, restaurant meals, or mixed meals including multiple items, and thus the comparison to FCS (which can be used for these purposes) should be interpreted in that context. Conversely, validation of these scores against health outcomes has necessarily assessed all foods and beverages as consumed.25-31 The very high correlations between HSR and Nutri-Score (often approaching r=0.90) indicates these two systems provide very similar information on foods. In contrast, FCS only moderately correlated with these other NPS overall, and much less for categories like fish & seafood, beverages, grains, vegetables, dairy, legumes, nuts, & seeds, and savory snacks and sweet desserts.
The HSR is a continuous score used to create 10 rating categories, ranging from half a star to five stars. Compared to Food Compass, the overall correlation was moderate (Spearman r=0.67) (see the below table of Correlation between Food Compass Score and other NPS). In other words, HSR explained only about 45% of the variation described by the FCS. This correlation varied widely by food category, with the highest correlation for fruits, as well as meat, poultry, and eggs. The correlation was much lower for savory snacks & sweet desserts, legumes, nuts, & seeds, grains, and vegetables.
Correlations between the Food Compass (Original and FCS 2.0), the Australian and New Zealand Health Star Rating (HSR), the Nutri-Score, and the NOVA food classification system.

4. Labonte, M. E. et al. Nutrient Profile Models with Applications in Government-Led Nutrition Policies Aimed at Health Promotion and Noncommunicable Disease Prevention: A Systematic Review. Adv Nutr 9, 741-788, doi:10.1093/advances/nmy045 (2018).
9. Pomeranz, J., Mozaffarian, D. & Micha, R. Mandating front-of-package food labels in the U.S. – What are the First Amendment obstacles? Food Policy 86, Epub 19 June 2019, doi:https://doi.org/10.1016/j.foodpol.2019.05.005 (2019).