Gregory Crane
In part one, I discussed the frequency of different vocabulary items and ways by which learners could track how many words they knew in a particular corpus as they went through some sequence of vocabulary acquisition. I focused upon the first book of the Homeric Iliad as an immediate target corpus and on how learning the vocabulary of this chunk would transfer when readers moved to other sections of the Iliad and Odyssey.
This second part focuses on the problem of visualizing what learners have and have not seen, what new vocabulary they have just encountered, and what new and future vocabulary is above or below some threshold separating common from uncommon words. The goal here is not to provide a finished design but to present a draft that can be developed further. The technology employed is relatively simple — the visualizations are implemented as Support Vector Graphics (SVG) objects. The next version will probably be in some dialect of Javascript but the figures below demonstrate one model by which to convey the more granular view of vocabulary.
I assume the ability to visualize aggregate changes in vocabulary knowledge as in Figure 1 (below):
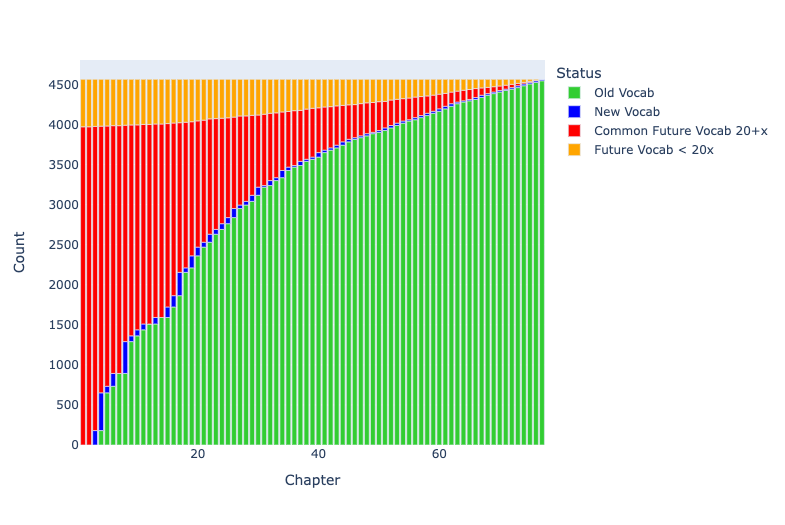
Figure 1 shows how learners working with Clyde Pharr’s Homeric Greek encounter 100% of all vocabulary items in Iliad 1 over the course of the book’s 77 chapters. Running words belonging to known vocabulary items are represented as green, new words as blue, unseen and common words as red, and unseen but uncommon words as orange.
Figure 2 illustrates how known, new, and unknown words are distributed throughout Iliad 1. I should emphasize that the visualization is itself a general tool designed to show the distribution of different phenomena across the 48 books of Homeric Epic with a particular focus on one book at a time. It could track any variables — e.g., dialogue vs. narrative, references to Achilles vs. Hector, or to optatives or particular clusters of repeated words. In this case, we just happen to be tracking and prioritizing what words learners have and have not seen.
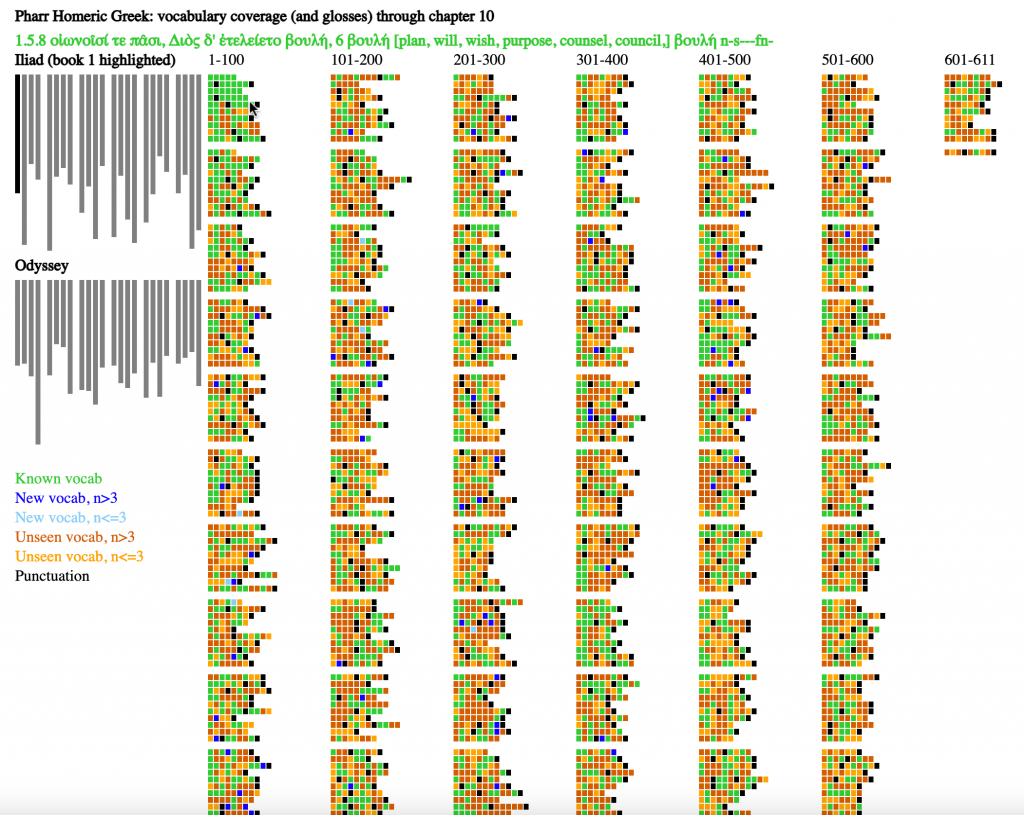
Figure 2 (above) provides a visualization of the Homeric Epic, with a focus on book 1 of the Iliad. The visualization is a simple mockup to explore features that a more mature and technologically sophisticated visualization would exhibit. It consists of a SVG figure in an HTML file. It offers limited interactivity — mousing over the representations of individual words and books of the Iliad and Odyssey causes information to appear (in figure 1, there is information about the word boulê, “will, plan” (as in the “plan of Zeus”) that appears 8th (and as the final) word in line 5 of Iliad 1.
The visualization contains two major parts. The left part, in a combination of black and grey, provides an overview of the Iliad and the Odyssey.
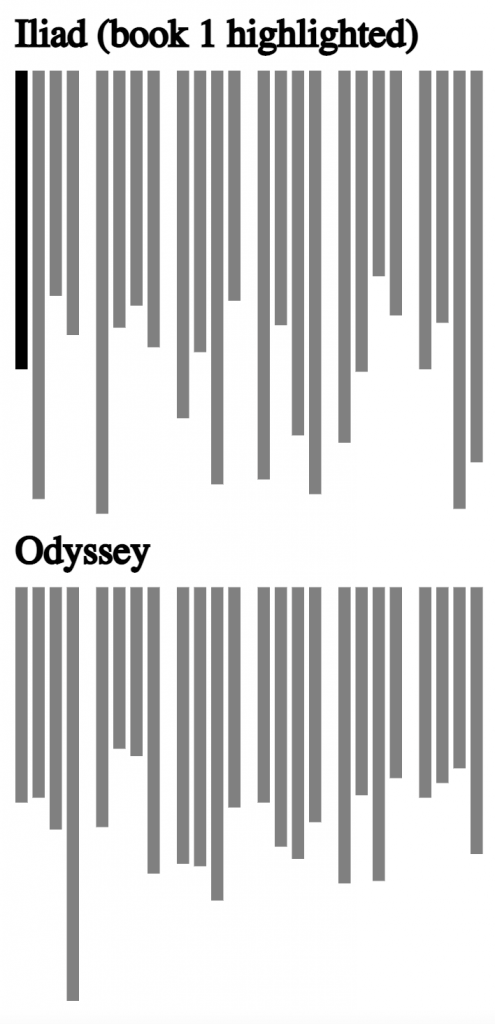
The left side of the figure above provides a representation of each book of the Iliad and of the Odyssey, 48 books in all. The length of each column reflects the relative number of lines in each book. The book illustrated in the main part of the visualization is highlighted as black, with the other 47 books as gray.

Colors were chosen based on the recommendations of Bang Wong [“Points of View: Color Blindness,” Nature Methods 8 (2011)] to minimize the impact of different forms of color blindness to make the color palette of visualization as accessible as possible. Colors describe six different features:
- Vocabulary items that students have seen so far (in figure 1, the first 10 chapters of Pharr’s Homeric Greek) are lime green.
- Vocabulary items introduced in the most recent lesson (chapter 10 of Pharr’s Homeric Greek) that appear more than 3 times in Iliad 1 appear as blue.
- Vocabulary items introduced in the most recent lesson that appear 3 or less times appear as light sky-blue. The goal is to help learners prioritize the vocabulary on which they focus, emphasizing more active command for more common words.
- Vocabulary items that learners have not encountered and that will appear more than 3 times in Iliad 1 appear as vermilion (a darker reddish color). Learners can skip ahead and see which frequent terms appear.
- Vocabulary items that learners have not encountered and that will appear 3 times or less in Iliad 1 appear as orange.
- Punctuation marks are listed as black. This allows readers to get an overview of sense breaks in the poetry (insofar as editors have chosen to represent these sense breaks with punctuation). At present, every form of punctuation is marked. It may well make more sense to include only full stops (and not commas) as a default.
The main section of the visualization presents one small box for each word in the Iliad 1. The length of each row reflects the number of words in each line. There are breaks between every 10 lines and each column contains up to 100 lines.

Figure 5 shows a close-up from figure 1. Almost every word in lines 1-5 is green (a known vocabulary item) or black (punctuation): Pharr begins with the start of Iliad 1 and moves through the poem a few lines at a time in each chapter. The one word that is unseen (word 3 in line 5) is a form of the adjective pas, “all, each.” The grammar has not introduced third declension adjectives yet and thus this word is not yet in the vocabulary (it was covered with a note to the text)

Figure 6 illustrates information about a particular word. The reader has moused over the 4th word in Iliad 1.109, sees the text of this line, discovers that it is a form of the name Danaans (one of several words to describe the Greeks) and that this word shows up 10 times in Iliad 1. A gloss from Pharr, the inflected form and a code for the part of speech (noun, plural, masculine, dative) follows.
Figures 7, 8, and 9 (below) show how the learners knowledge of vocabulary changes as they move through the text book, with snapshots showing where they stand.
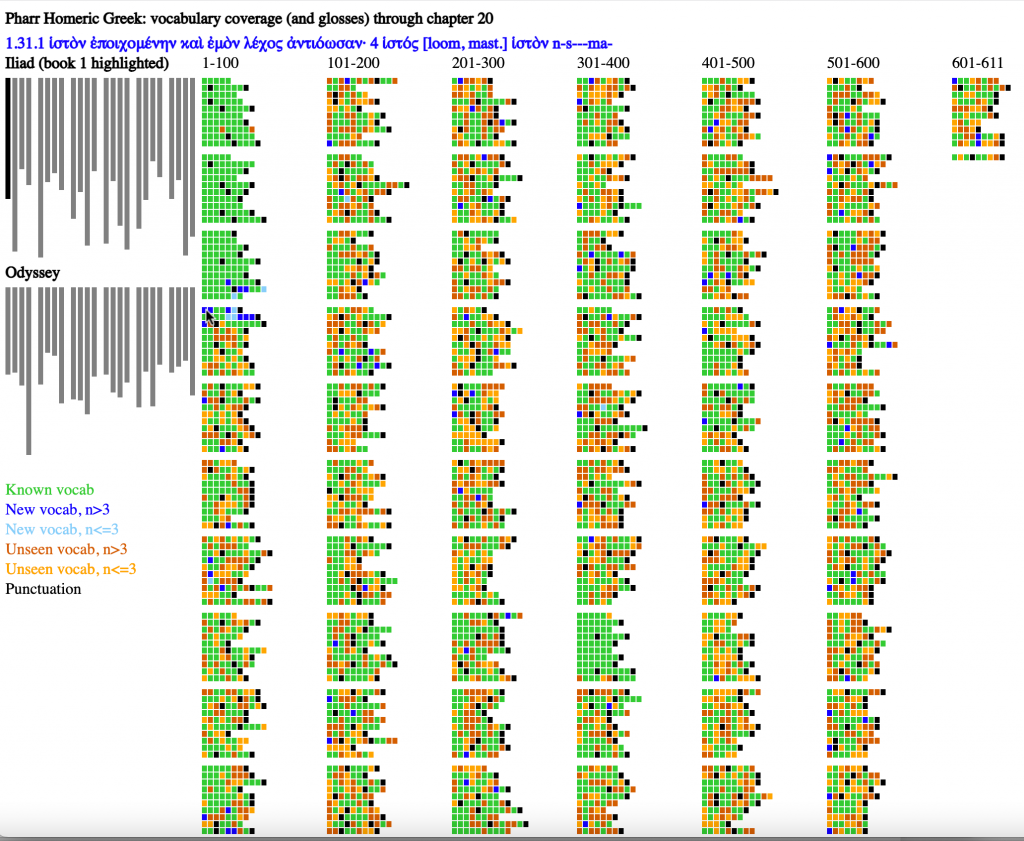
Figure 7 shows the state after chapter 20 of Pharr. This chapter covers Il. 1.28-32. A cluster of dark and light blue dots (depending on their frequency) in these lines shows how new vocabulary presented in this chapter was designed to fill in the gaps for these new lines. Places where the vocabulary presented in chapter 20 appears later in book 1 also appear as light or dark blue dots.
Even at the relatively low resolution of the image above, a solid block of green now appears at 1.371-379 and that block shows, not only to those of us who have worked on Homeric poetry for years but also to those learning Homeric Greek, how the oral tradition works. Iliad 1.372-375 repeats 1.13-16; 1.376-379 repeats 1.22-25. Iliad 1.371 does not repeat 1.12 but every word in 1.371 has already occurred. We can also note that 1.371-379 repeats two different chunks that are separated earlier in book 1 by a speech: Chryses’ request that the sons of Atreus accept ransom for his daughter (1.17-21). We can see at work here how the tradition can change the length of an account by selectively adding or subtracting lines.
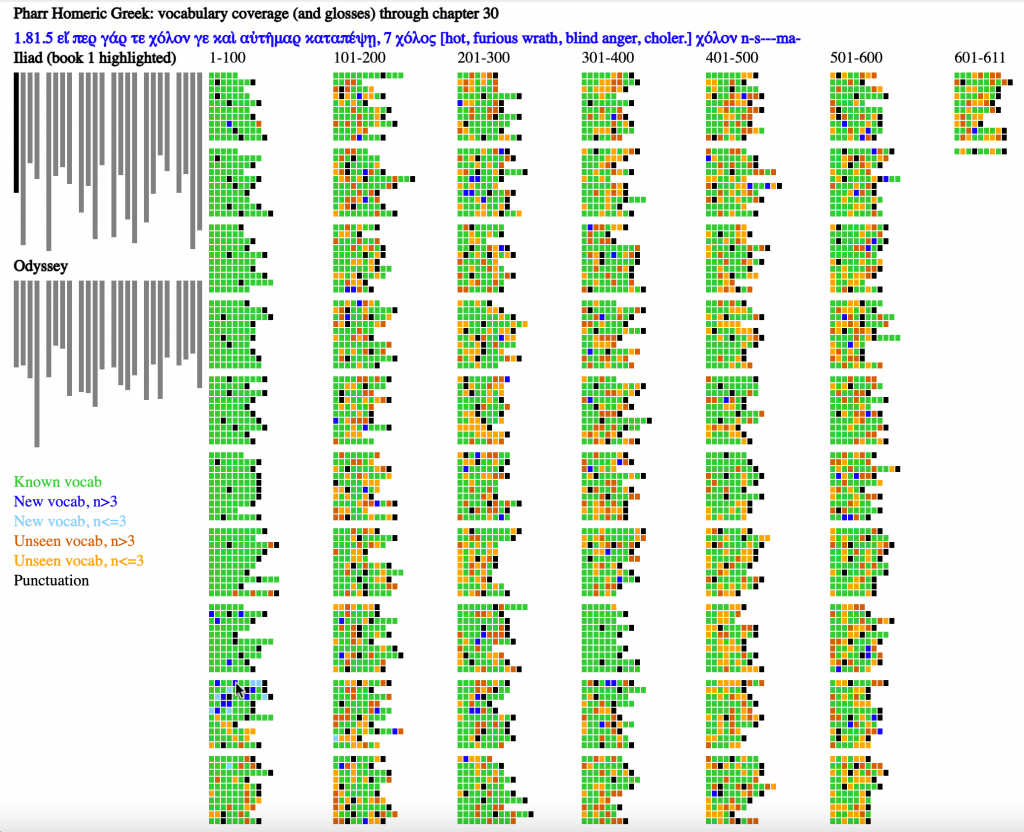
Chapter 30 covers Il. 1.81-85. Almost all of the words through line 82 appear as green. New vocabulary clusters in the lines covered in this chapter.
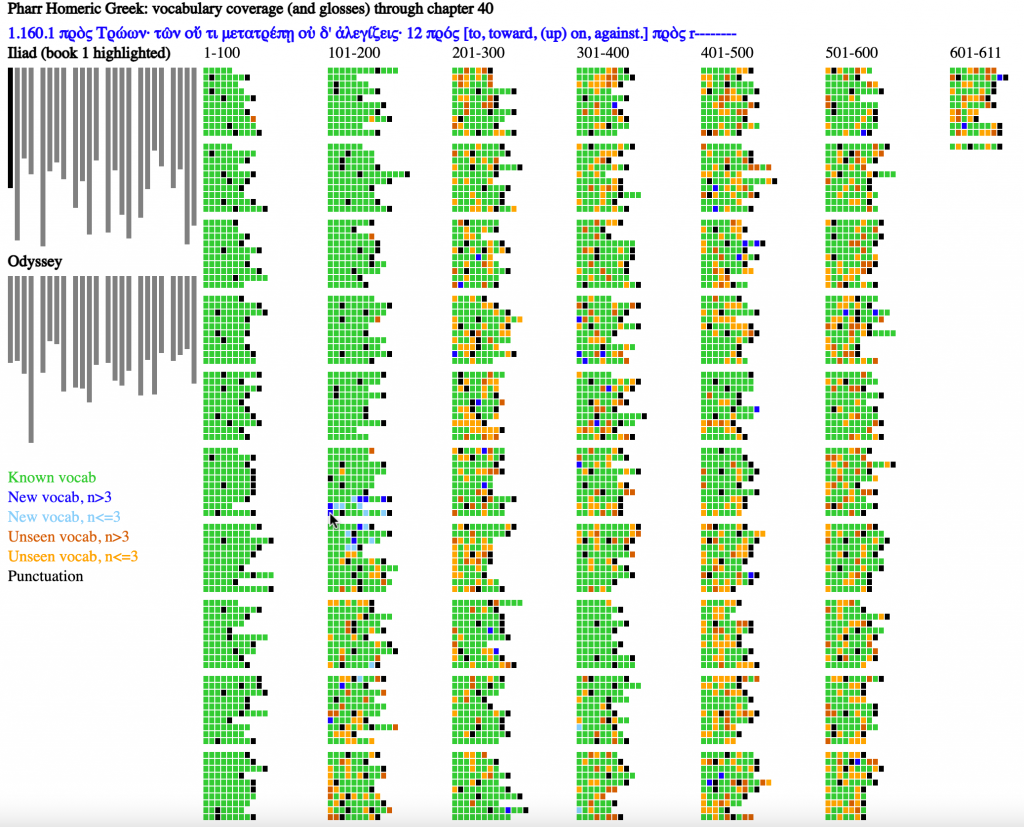
Figure 9 shows the state in chapter 40, which covers Il. 1.158-164. Blue dots cluster around the seven newly introduced lines. At the same time, the share of green dots, representing known vocabulary, has increased dramatically since figure 1.
At some point, learners will presumably want to move on another text beyond the first book of the Iliad. At the moment, we are able to recalculate what vocabulary readers will have seen if they move to a new book of Homer after any given chapter of Pharr.
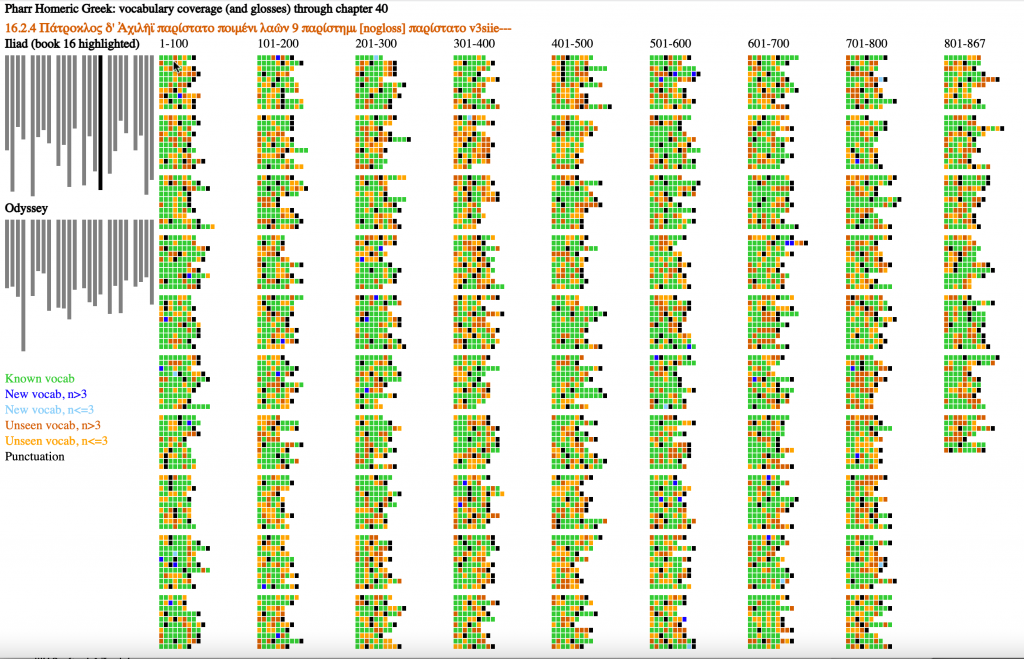
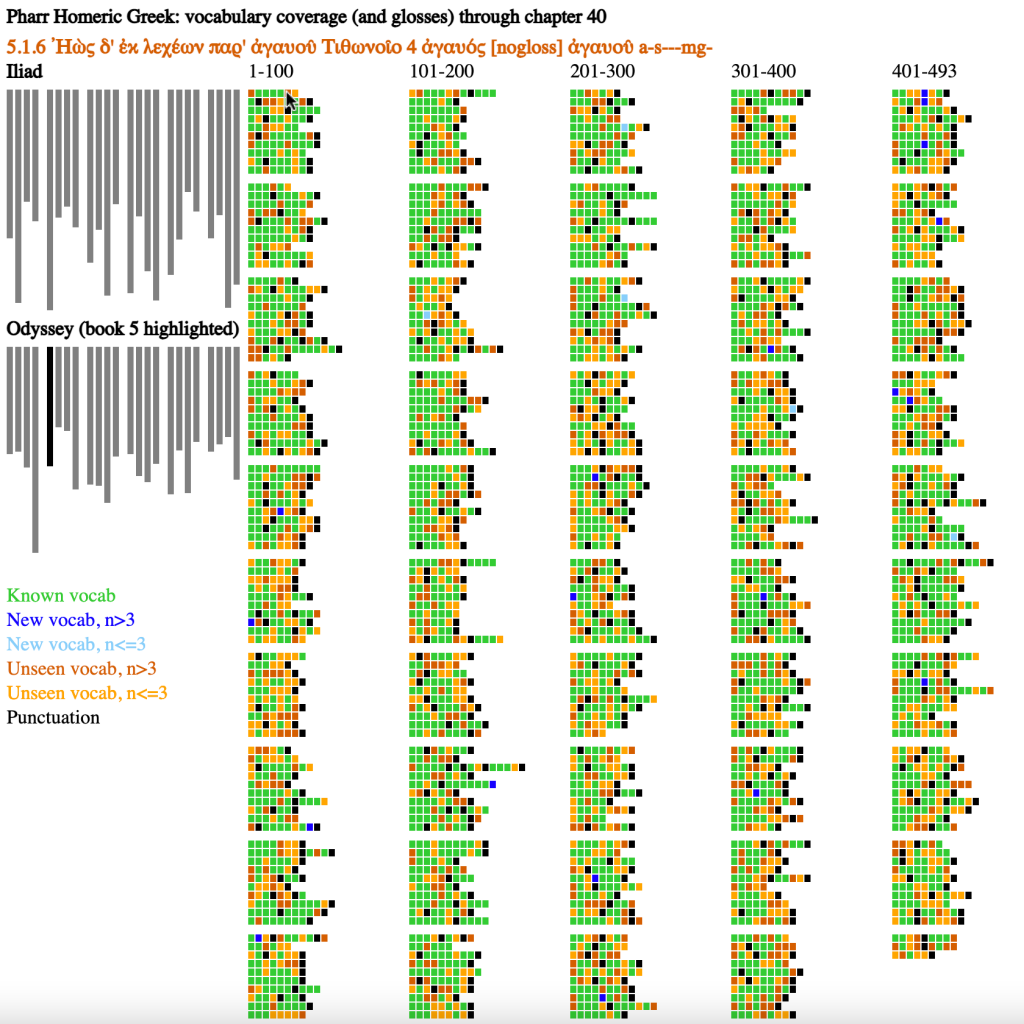
Work to be done
The images above are, as noted earlier, only mockups to help think through what a more finished system for learners to track what they (should) have learned and what they will need to learn going forward. I list below some of the more obvious topics.
- Support for word senses: the visualizations above assume that once learners have encountered the piles of glosses and synonyms that Pharr offers in his glosses, they can recognize the meaning of that word in any subsequent passage. Since words have multiple meanings –some words have very many meanings — that assumption is clearly false. In fact, we have several machine readable Greek-English dictionaries such as Liddell-Scott Jones, Cunliffe’s Homeric Dictionaries (including his dictionary of people and places), and the new Cambridge Greek Lexicon (which will hopefully appear on the Scaife Viewer in 2022). We spent a fair amount of time capturing the structure of the dictionary entries and giving each sense that had a label in the print lexicon a unique digital identifier. We could experiment with the benefits of linking to particular word senses and not just to the dictionary headwords.
- Support for inflection: visualizations above assume that once learners have encountered a dictionary entry, they can understand all of its forms. Greek verbs, however, have many different inflectional pattern and traditional learners of Greek spend much of their time learning the many ways Greek verb forms can be generated. We actually have segmented words (as appropriate) into preverbs, augments, stems, and endings, with labels for different inflection categories (e.g., first vs. second declension). We could identify which forms of a new verb learners could already parse and which forms follow paradigms that they have not yet learned. In an earlier version of this work, I tracked which forms learners could parse at any given time but decided that the added complexity was not worthwhile (at least until we have a more customizable system). As it is, we have the inflectional analyses for every word in the Homeric Epics. Learners develop practice using lookup tools to parse unknown forms.
- Relative frequency in each of the 48 books of Homeric Epic: The left-hand side macro-view should show how many words readers would know for each of the 48 books of Homeric Epic. Readers could see at a glance if some books stand out because they share more or fewer vocabulary items. Such a visualization requires normalization — the longest books of the Iliad are twice as long as the shortest books in the Odyssey.
- Implementation as a fully-interactive, browser based visualization: The SVG implementation shown above does support some interaction but a more mature implementation would allow for many different use cases and could be customized in many different ways.
A great deal of work in digital philology goes into the backend processing of textual data and into the production of new conclusions. We also need a great deal of work on the design of very basic visualizations that can reveal through our highly developed visual abilities linguistic patterns that our ears will not catch and that our eyes will not see as they scan text a word at a time. We need — and we will ultimately have — new dashboards — aggregations with multiple visualizations at a glance — that allow us to work with our textual sources at scale. Once we happen upon visualizations that reach a certain level of functionality, the field will cluster around them. Soon they will be taken for granted as if they had always been there. We are, however, a long way from that state. My goal here is to push the process along, whether that leads to improving what I have presented or to a wholly different, and more effective, approach.
Acknowledgements
This work was made possible by the Beyond Translation Project, funded by NEH HAA-266462-19, by Harvard’s Center for Hellenic Studies, by the Data Intensive Studies Center at Tufts University, and the German Academic Exchange Service.