
Results
This section describes our experimental progress! We do not go deep into our specific aims here, but these experiments and analyses are the foundation of our project
Cell culture Workflow
Arrietty and Kerry developed a cell passaging protocol for the HMC3 cell line and passaged cells independently.
Arrietty, Varshini, and Kerry shadowed the postdoc in our lab, Maria, to complete the training for the Lyso-tracker optimization!
Lyso-tracker staining was performed to visualize lysosomes (which contain lipofuscin, a biomarker for oxidative stress and secondary injuries) and analysis was done to determine the optimized Lyso-tracker volume.
New microglia cells were seeded prior to the LPS treatment on the 27th of February. On the following day (i.e. after 24 hours), we performed label-free imaging using TPEF and then applied the lysotracker green and Nile blue dye.
We have prepared a final protocol for the glutamate induction. For each time point, we performed a ROS assay and acquired TPEF images.
Imaging Workflow
We used an excitation wavelength of 504 nm instead of 488 nm for microglia LPS induction. We want to use 488 nm because it is the maximum excitation wavelength for lysotracker dye so it will give us stronger signals.
LPS induction figures
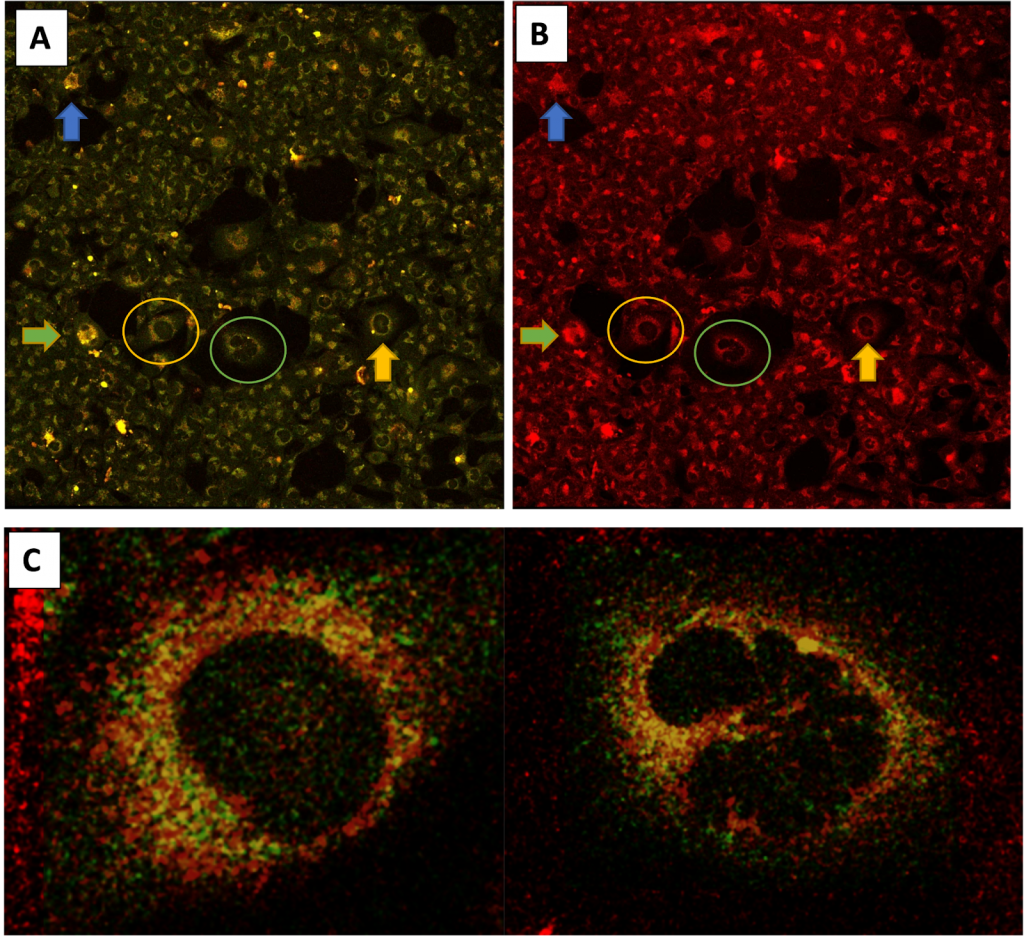
An ROI of the corresponding (A) TPEF (red and green channel) and (B) Confocal (red channel) images at 755nm ex. The color-coded arrows identify the same characteristic cells for each image. TPEF was performed before Nile Blue and LysoTracker Green staining while Confocal was performed after. (C) Co-localization of the lipofuscin autofluorescence (green channel only of TPEF) with Nile Blue and LysoTracker Green dye (red channel of Confocal) is indicated by the yellow color for 2 different cells in the ROI as indicated by the circles.

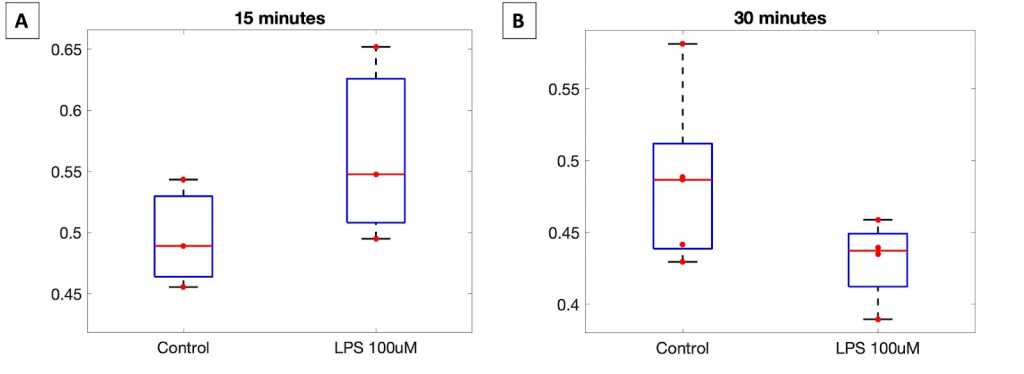
Signal-to-background ratio (SBR) of confocal imaging of LPS-induced microglia with LysoTracker lysosomal stain (treated) and no stain (untreated)
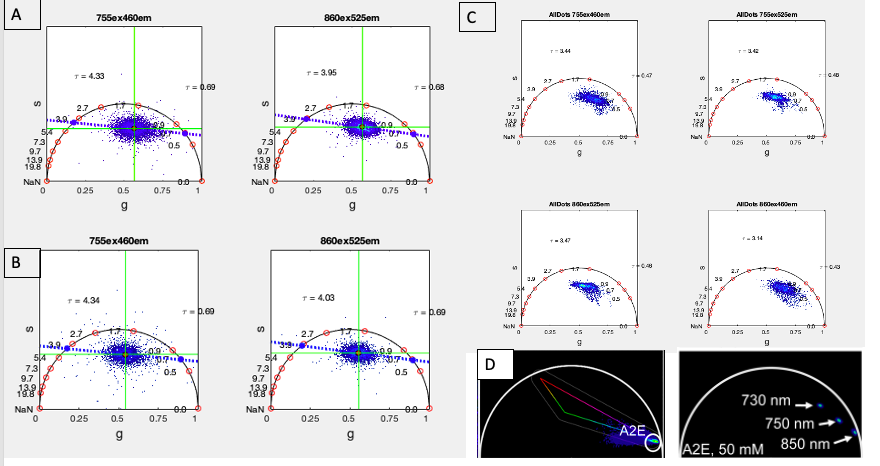
Phasor representation of FLIM data acquired from 2D microglial monoculture subject to LPS induction. (a) Control well not subject to LPS treatment. (b) LPS-induced representative well. (c) Phasor of specifically bright regions identified as lysosomal lipofuscin from the co-registration analysis depicted in Fig. 3. (d) References of phasor distributions of lipofuscin lifetime; here from Palczewska et. al’s study of lipofuscin found in the retina.
The redox ratio results for the TPEF imaging of LPS incubation were unexpected. This experiment merits one more repeat or the redox data from this data should be combined with redox ratio data from previous LPS induction experiments to determine which of these conditions is inconsistent.
Glutamate induction Figures


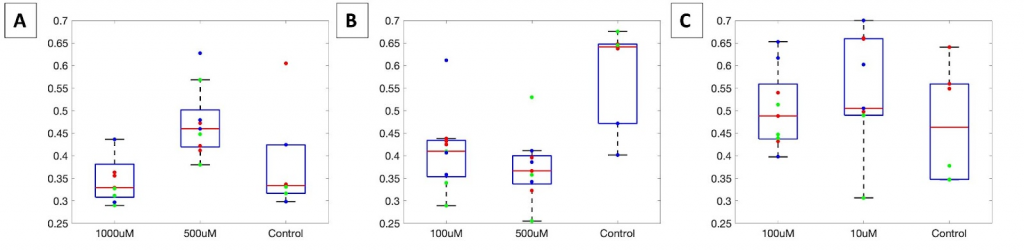
The redox ratio for the control is inconsistent across the time points, suggesting an inconsistency in the seeding
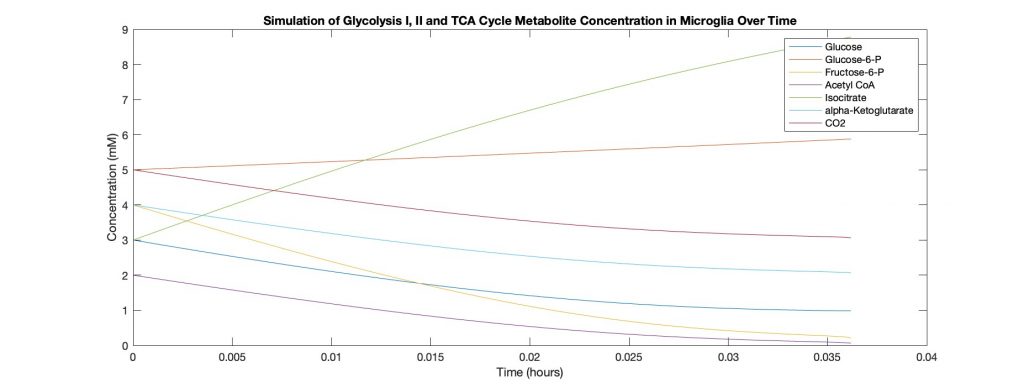
Microglia Computational model framework
Initially, we ran a code based on Dr. Çakir’s work for astrocyte and neuron metabolic pathways. We shifted focus to microglia and started a code to model that from scratch. We were able to create a simple model that uses the most researched reactions from glycolysis I/II and the TCA cycle to track 7 main metabolites: glucose, glucose-6-P, fructose-6-P, pyruvate, citrate, isocitrate, alpha-ketoglutarate, CO2.
Discussion and Future Work
In the first semester, we read through papers relevant to TBI metabolism and TPEF imaging. We communicated with our post-doc and lab professor to start training for culturing microglia and using them for TPEF imaging. We developed a protocol for inducing and assessing secondary injury in co-culture models completely from scratch, which took significant efforts to rework and optimize given constraints of the Georgakoudi lab in cell culture methods. We researched the computational model using papers which aimed to do the same using differential equations. We have prepared our cell culture and imaging to induce our first injury experiment next week. In the second semester, we hope to finish developing our mono- and co-cultures for imaging and metabolic analysis, and have a framework for the metabolic model. With monoculture data from the first semester, we will be able to link the optical readouts with the metabolic data using statistical tools on MATLAB. We can compare this correlation in data to our computational model framework and adjust it as needed.
In the second semester, we have been able to make significant progress in the lab, but due to issues with cell cultures, are focusing only on microglia cell cultures. This will affect our results by narrowing our results. However, given the time constraint, microglias are a good alternative that is still relevant to our aims. For the computational model, we created a framework from microglia from scratch which still needs to be integrated with our experimental results and further developed to take into account edge cases.
The goal of our project is to correlate optical measurements with biochemical and metabolomic assays. Understanding this correlation will allow us to develop algorithms to predict biochemical and metabolomic data purely from optical readouts. This is valuable because it reduces the time and cost required to see the metabolic effects of TBI on brain cells. Culturing cells and completing assays can cost thousands of dollars over the span of many months. The development of this algorithm will make it possible to do TBI research in a shorter time span and a smaller budget. This broadens the availability of TBI research to labs that do not have the resources to do cell culturing long-term. This also helps address the morality of using engineered brain tissue because it reduces the need for handling it.
For future work, we hope to achieve the following
● Tune computational model for specificity to this study by incorporating LPS/glutamate pathways
● Perform mass spectrometry to obtain relevant metabolite concentrations as inputs for computational model
● Study synergistic effects of glutamate induction on LPS-activated microglia
● Induce injury on 3D co-cultures and tricultures involving neurons, astrocytes, and microglia