
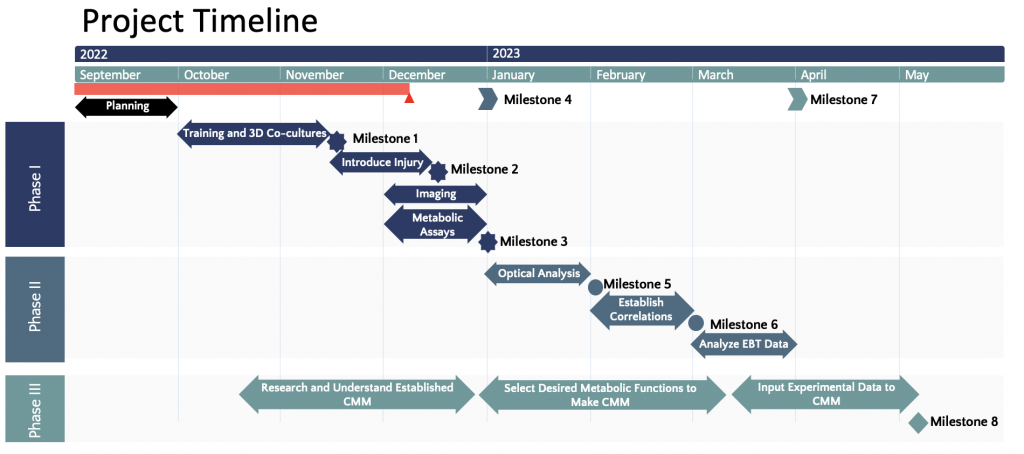
Milestone 1: Successfully (1) complete all required training (TPEF imaging and cell culture) and (2) create a suitable protocol for the 3D co-cultures where the cells have high viability.
Milestone 2: Induce secondary perturbation (LPS and glutamate) to 3D co-cultures (neuron-microglia and neuron-astrocytes, respectively). This can be validated by using mass spectrometry to detect and measure the concentration of the main metabolite involved in the secondary injury to confirm that the level is high.
Milestone 3: Image cultures with multimodal two-photon microscopy and perform metabolic biochemical assays with no problem.
Milestone 4: Obtain sufficient data to perform analysis and start Phase II
Milestone 5: Analyze all obtained images with the appropriate method for each imaging modality to obtain relevant optical readouts. The obtained values should be statistically significant and, if possible, will be validated with values published in research papers. Differences between hypothesized and actual outcomes at this stage will drive the rest of Phase II and may lead to repeats of experiments performed in Phase I.
Milestone 6: Establish the relationship between optical readouts to the corresponding results from the assays. Statistical analysis will be used to confirm that there exists a strong correlation between the two variables. Additionally, the most suited regression model will correctly predict the obtained assay readouts from the optical inputs.
Milestone 7: Characterize the molecular basis of the optical readouts for the EBT data using the established regression model.
Milestone 8: Create a computation metabolic model using the optics-molecular data. Performance of the model will be compared to published model. While there’s no established computational metabolic model for TBI, the computational metabolic model under normal condition can be modified using TBI-specific variables to mimic TBI conditions.