Pharmacokinetic Model
A Pharmacokinetic Model of Lead Absorption and Calcium Competitive Dynamics
(59)
Rădulescu, A.; Lundgren, S. A Pharmacokinetic Model of Lead Absorption and Calcium Competitive Dynamics. Sci Rep 2019, 9 (1), 14225. https://doi.org/10.1038/s41598-019-50654-7.
Purpose of Pharmacokinetic Model in Relation to Lead
A pharmacokinetic model is a mathematical technique that can predict the effects of certain chemicals on humans without actually testing the chemicals on live humans.59 The pharmacokinetic model predicts the path of substances in the body. There are usually a few different equations used in one pharmacokinetic model. This is because molecules like lead travel differently through various tissues. The equations for different tissues are adjusted based on many factors that could affect speed of diffusion. For example, one factor that must be taken into consideration when deriving the model is lipid content. The different types of tissues that were compartmentalized in this study were blood, bone, kidneys, brain, and soft tissue.
A pharmacokinetic model is most commonly used to predict the effects of pharmaceuticals. However, in this paper, the model is being used to predict the effects of lead on the body and the competitive dynamics between calcium and lead. Through learning more about the way lead travels through the body, scientists can better understand the absorption, metabolization, and mechanisms that produce medical consequences. It is well known empirically that higher calcium levels help to thwart the effects of lead poisoning. The pharmacokinetic model can predict the interactions between calcium and lead which provides scientific evidence for this observed relationship.
Pre-Existing Models and the Rădulesc-Lundgren Model
Several pharmacokinetic models for lead dynamics have been built in the past. These have varied in the number of compartments, differentiation of types of tissue, route of lead exposure, overall focus and purpose, and ability to assess risk.
One of the earliest models, the Lead Metabolism Model built by Rabinowitz et al. in 1976, includes three compartments and differentiates between “deep” and “shallow” soft tissue (interestingly, this study entailed human subjects ingesting lead).60 The Marcus Model (1985) expanded upon this model, with several components for cortical and trabecular bone tissue.61 Subsequent models adapted this approach to bone tissue with other added complexity, such as age-specificity and increased compartment number.59, 62, 63, 64
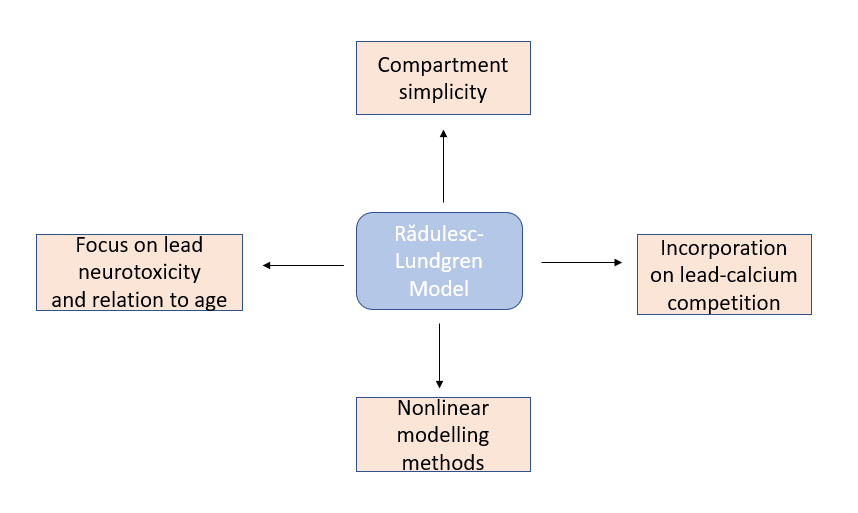
The model described in this paper (Rădulesc-Lundgren) draws from these past models, but is unique in several aspects. It specifically builds from Rabinowitz’s model, which has fewer compartments than newer models. As seen in Figure 1, their model incorporates new, updated information about lead molecular dynamics. The authors mainly focus on lead’s neurotoxic effects, as well as the relationship between lead and calcium. Past models do not address the observed age-related symptoms of neurotoxicity as a response to very small doses of lead, so the authors aimed to use a nonlinear model to investigate “counterintuitive” observations of lead’s toxicity (i.e. its dose-effect relationship); nonlinearity is pertinent because lead-calcium dynamics are saturable.
`The authors were interested in calcium because calcium is related in many ways to lead concentration and its effect in the body, and calcium is essential for many cognitive processes (see Lead and Calcium). There is a competitive relationship between the two. This interaction is especially pertinent at the blood-brain barrier, where lead can replace calcium, which is necessary for cognitive function, on membrane transporters. Also, it has been observed that dietary calcium levels impact lead toxicity.65 Thus, the authors wanted to incorporate the interactions of lead and calcium into their model and investigate the impact of their dynamic on lead neurotoxicity.
(The rest of this page will be exclusively referencing the procedure and results of Ref. 56.)
Compartments of Rădulesc-Lundgren Pharmacokinetic Model
As mentioned earlier, the model was broken up into 5 different compartments. These compartments were blood, bone, kidneys, brain and other soft tissue. All of these compartments are important to understanding the physiological effects of lead poisoning. The relationship between each of the five compartments is mapped out in Figure 2.
1. Blood was an important compartment because lead must enter the bloodstream before it can travel to any other tissues. In addition, researchers wanted to examine the competition between lead and calcium molecules. An inverse relationship has been historically observed between calcium intake and blood lead concentration. The researchers hoped that the model could provide some quantitative evidence for this empirical relationship.
2. Soft tissue was examined in this model because mechanisms by which lead transits between blood and soft tissue are mostly unknown. The mathematical model could give insight into transport mechanisms and whether or not these mechanisms involve calcium competition.
3. Kidneys are necessary to the pharmacokinetic model because they give the most insight into how lead leaves the body. The authors were interested in how kidney damage by lead might cause further lead accumulation (a “broken feedback loop”).
4. Bones are one of the most affected parts of the body during lead poisoning. The calcium-lead interactions are of specific interest for this compartment. This is because lead forms highly stable complexes with phosphate and can replace calcium in the calcium-phosphate salt that compromises the primary crystalline matrix of the bone. Also, bone resorption and deposition levels vary with age.
5. The Brain was the primary focus of this model. One of the most harmful impacts of lead poisoning is nervous system damage. Lead affects virtually all neurotransmitter systems through replacing calcium in blood brain barrier transport. The model hoped to provide a pharmacokinetic basis of children’s brain sensitivity to lead poisoning.

Significant Results
The authors found that their model largely supports observed dose-effect relationships, but in other cases the results are highly complex and warrant more investigation. Overall, the authors encourage pursuing lead-calcium competition to further understand and potentially treat lead toxicity.
The kidneys’ response to lead is linked to a “broken” feedback loop; lead toxicity impairs the kidneys’ excretion capabilities, so lead accumulates more because it is not being excreted, and its toxicity further damages the kidneys. Higher kidney sensitivity, k, was observed to cause renal calcium and lead accumulation. The authors found that the k is not responsible for brain calcium levels, but did result in a build up of brain lead. Bone resorption causes the loss of bone calcium and lead as it enters the bloodstream. Varying bone resorption levels, z, did not impact levels of brain lead and calcium.
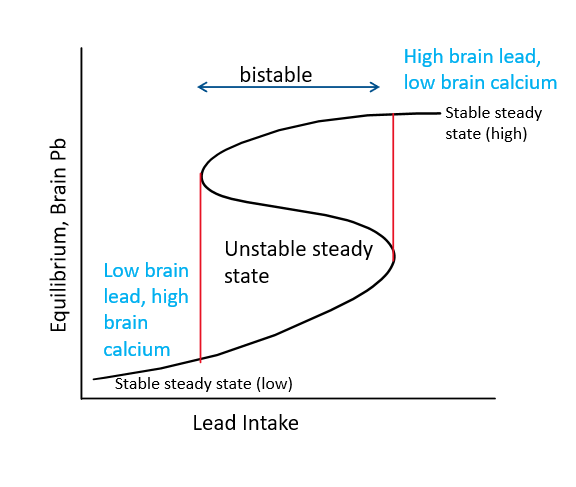
For all components except the brain, a higher lead intake increases the lead content and decreases the calcium content. For the brain, when lead intake increases, the potential for a higher lead and lower calcium steady state increases, because the system enters a bistability window. As seen in Figure 3, there are two outcomes, low brain lead and high brain calcium (“good”) and high brain lead and low brain calcium (“bad”). With further lead intake, only the high lead, low calcium steady state is possible. Bistability means that a system has two stable equilibrium states and an unstable equilibrium between the bistability.
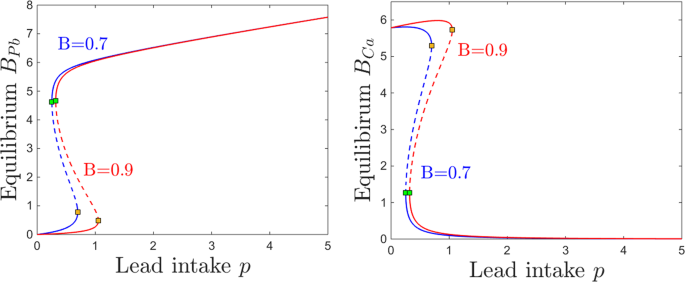
Most pertinent to lead neurotoxicity are the parameters describing the efficiency of the blood-brain barrier normally, B, and its sensitivity to lead, s. This is closely related to the age in which lead exposure occurs, as the blood-brain barrier develops over time. A higher B, found in a fully developed brain, limits accumulation of lead and encourages accumulation of calcium. The authors found that at for a lower B, as found in an immature brain, lower doses of lead cause the same neurotoxic effects that would require higher doses in mature brains. Also, for immature brains, higher calcium intakes are necessary to attain the same steady state levels that could be achieved with lower calcium intakes with more efficient filters. These results are exemplified in the graphs included in Figure 4.
This pharmacokinetic modelling can provide a mechanism for nonlinear responses to low lead exposure in children. It has been empirically observed that the neurotoxicity of lead is proportionally greater at lower concentrations for children. This model supports this observation, showing that small changes in lead intake have more significant implications for children because of their immature and more sensitive blood-brain barrier.
December 4, 2021 at 10:17 pm
Small note: you have 2 figure 2’s
I think you did a great job of concisely summarizing this research paper! One note that might help incorporate the figures more into this page would be to give some sort of “See figure x” or reference so that the reader can actively interact with the text and images add they are reading. I understand each figure’s place in the paper but it would be nice to be able to see how those figures incorporate with your writing.
December 6, 2021 at 10:33 pm
I’m a little unsure about the citation at the top of the page. Wouldn’t it be better if the citation were located in the references section of your website? Also, it appears that there is an errant apostrophe at the beginning of your 6th paragraph. Be sure to reference the figures in your writing. This helps to better contextualize your figures. Other than that, I felt that you did a good job with interpreting and relaying the results of the newly improved Rădulesc-Lundgren Pharmacokinetic Model of lead poisoning.
December 6, 2021 at 11:05 pm
This page is great! I like how you described how this pharmacokinetic model is unique from others and how these have been developed over time. The section where each of the five compartments and the reasoning behind including them are described was extremely clear and very educational. The results were also clearly summarized and easy to understand. Besides fixing the second figure 2 and referencing the figures in the text more like Aj suggested, I have no suggestions; nice work!