If you’re like us here at Tufts University, you might be interested in displaying your students GIS (or other types of) projects in an interactive gallery application! We searched for the right tool for weeks just to figure out that ESRI has the perfect app for what we wanted to do (no big surprise there!). However, there wasn’t a lot of information I could find on how to build the tool I was hoping to create and the ESRI help line didn’t have a lot of experience with it either, so I figured I’d write a blog post to help future educators like yourselves!
Collecting the Project Metadata
We already had a metadata form created with Django that we use to collect student GIS projects for our general GIS Expo Explorer application up and running here, so we didn’t have to do much to implement a new form.
In hindsight, using a Survey123 and hosted feature layer that fed into the Experience Builder application would have required a lot less downloading and uploading of CSVs and it would have allowed me to build and test the application while students actively contributed to it….but I digress. Oh well, lessons learned for next year!
Our current Django form collects student info (School, Department, Degree, Course info, semester/year) along with project metadata including high level topic keywords and more detailed subtopic keywords. We collect information on the methods used and the location of the project using a geonames lookup table. The students upload their posters or link to their storymaps/apps. We also have the student read and sign off on a copyright waiver allowing us to share their work. Lastly, as administrators, we can go in and check that we’ve reviewed the metadata, mark off if the poster is printed (for when we do in person exhibits) and prioritize the visibility of certain projects.
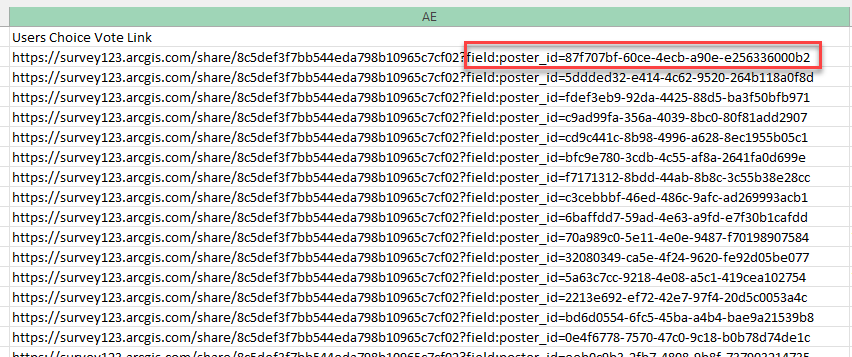
Next, I downloaded the CSV and spent even more time cleaning it! I add in additional columns for project award winners (true/false), award titles and a link to the award ribbon icon. Additionally, I add a field for a Users Choice Survey voting link (more on this later!).
Upload the CSV & Create an AGOL Web Map
The next step was to upload the clean metadata CSV into ArcGIS Online so I could create a web map of the projects. That’s easy enough to do through Content in AGOL. Lots of documentation on this.
This is where having it as a Survey123 hosted feature layer would have simplified the process a lot, but oh well, this really wasn’t that bad once i figured out all the columns I would need (which did take a lot of trial and error ha).
Once the CSV has been added as a hosted layer, it’s important to change the settings to make it editable (you can do this on the hosted feature layers settings page)! That way, I can add in info on the poster/story map award winners in that attribute column without needing to go back to the CSV and reupload!
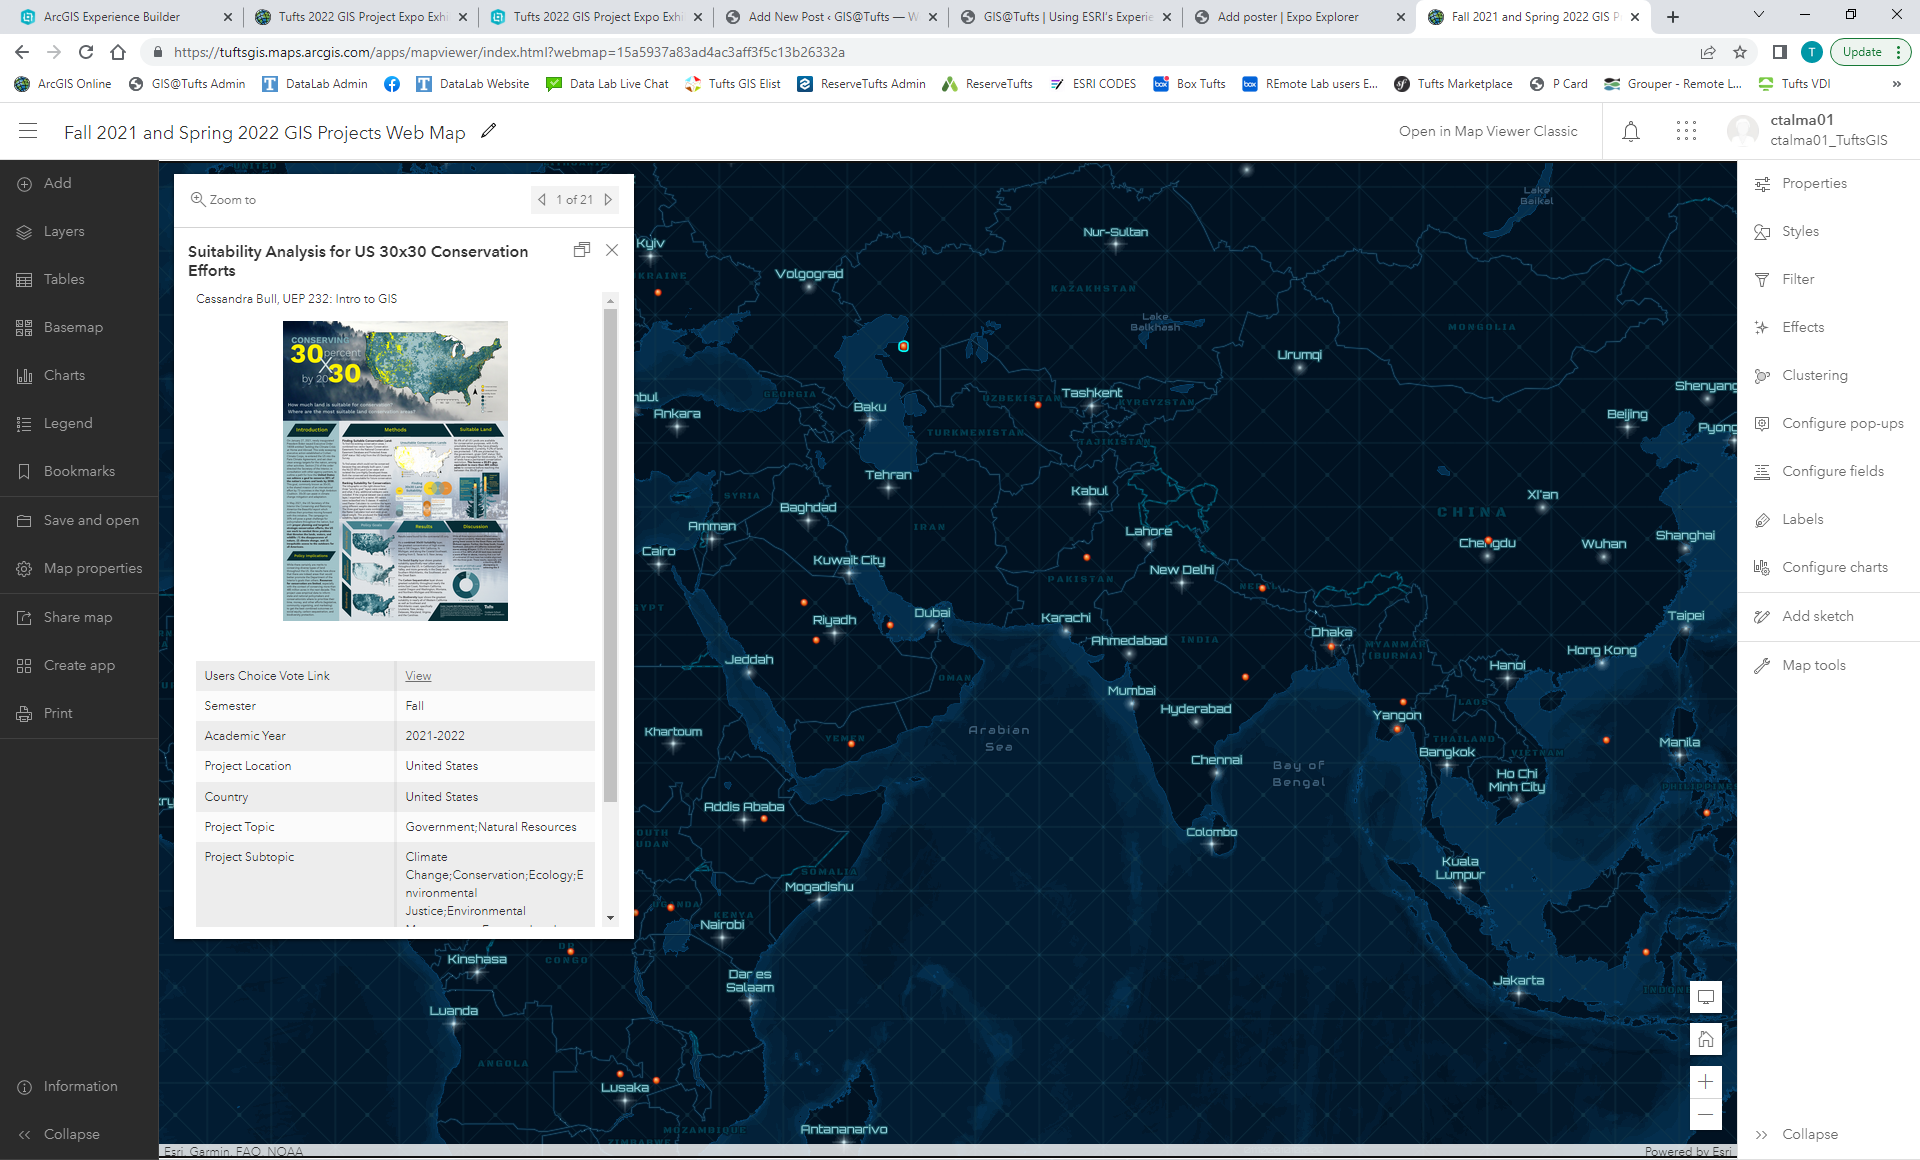
Next, open the layer in a web map and configure the pop ups so that it showed an image of the poster/storymap, along with all the relevant student and project metadata fields. Style the map so it’s pretty and functionable!
Building the Experience Builder
Next step was deciding on the ESRI application we would use. While talking to an ESRI expert, we bounced back and forth between the Experience Builder and the Category Gallery configurable app. But after a LOT of trial and error, we figured out a way to get the Experience Builder to function the way we wanted with a lot less work than the category gallery!
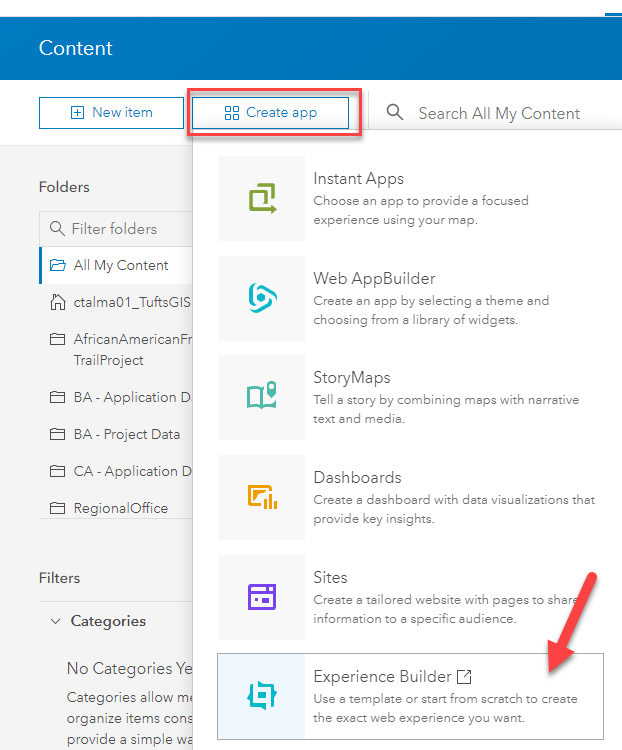
Start a new Experience Builder from Content by going to New –> Experience Builder.
Create a New Experience and start by choosing one of the templates or starting from scratch. We started with the Gallery template, but ultimately changed every widget so it might have been easier to start from scratch.
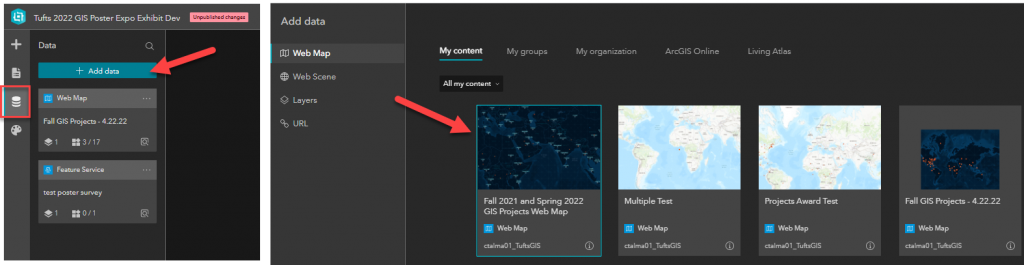
In the Experience Builder, the first step is to Add your Data source in the application, in this case the Web Map we just configured.
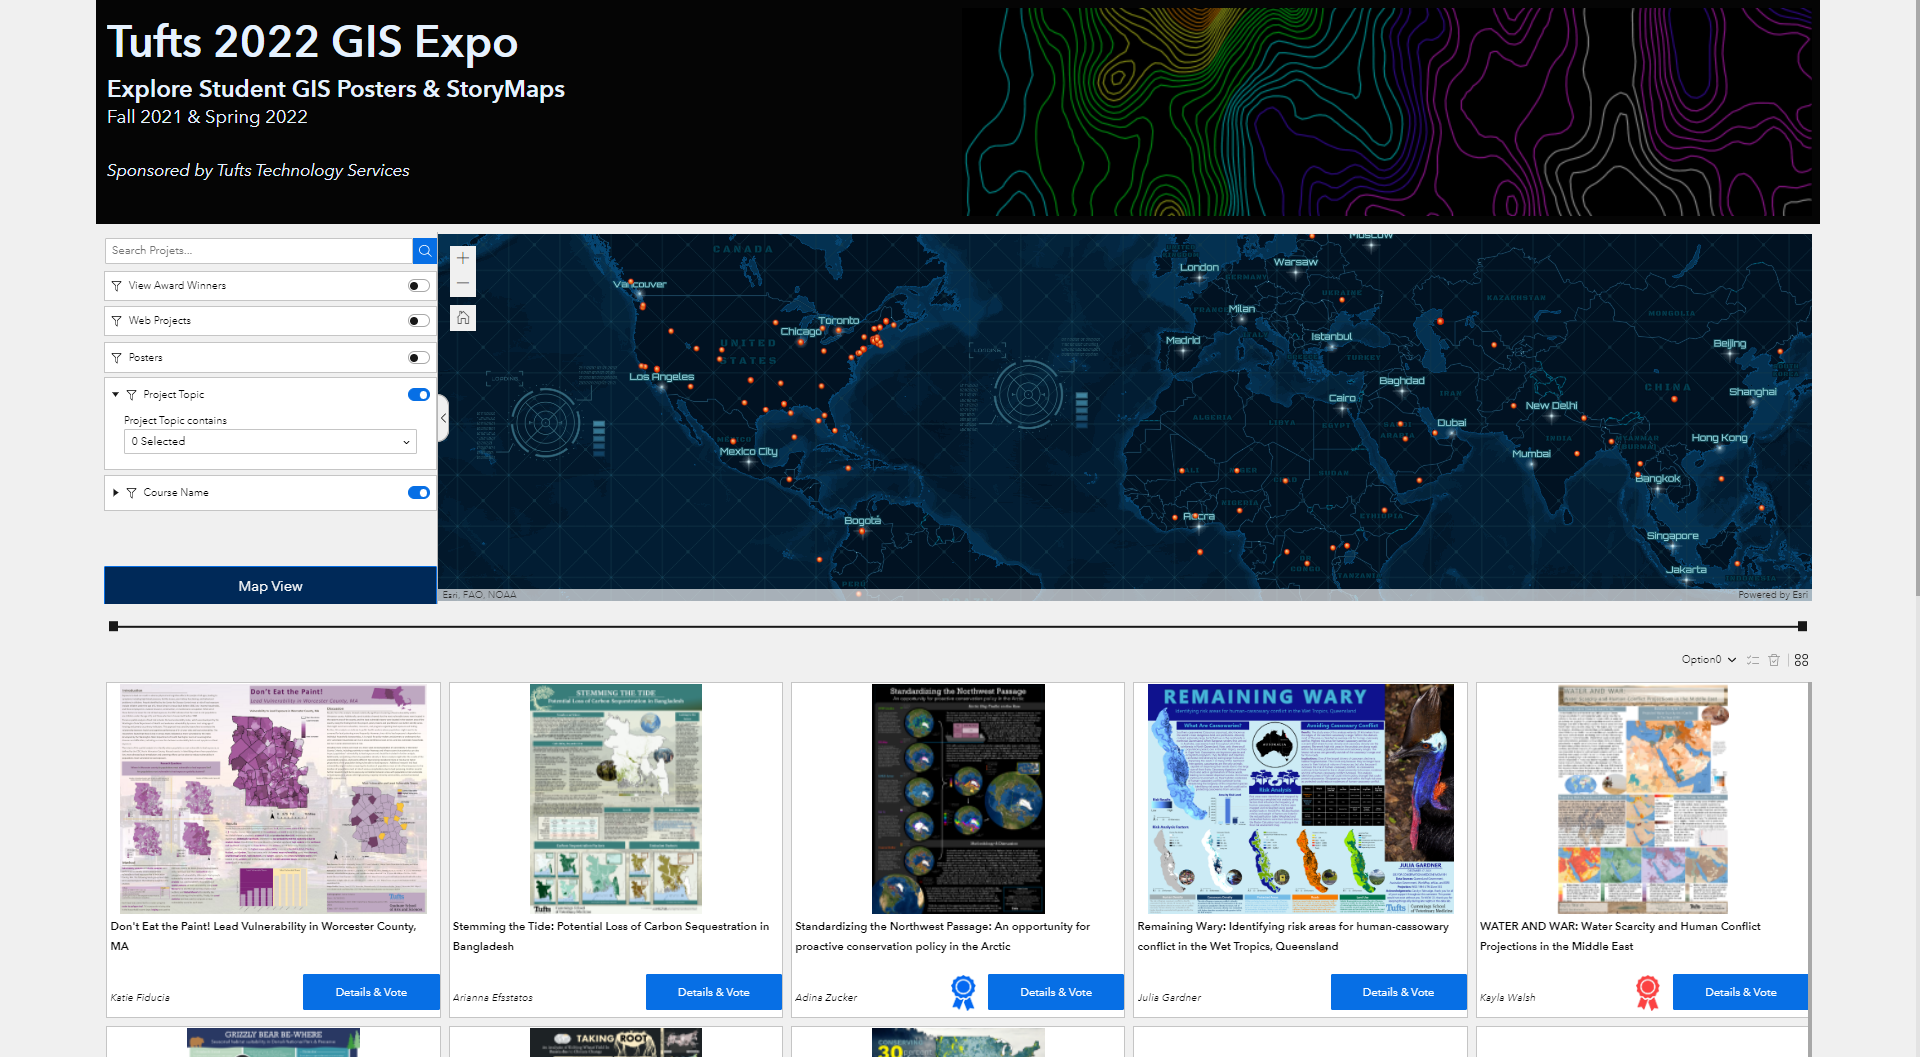
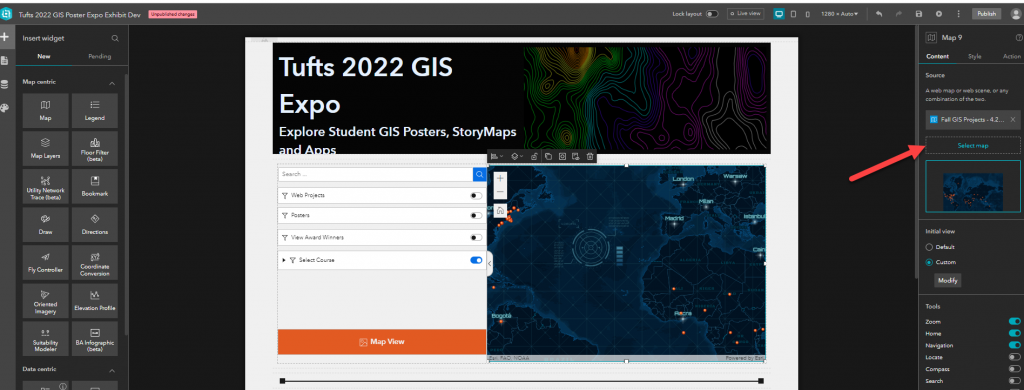
Then, we started building the Main Page with the Widgets. In the header section, we built the title of the application and inserted an image.
Next, we built the Main Map showing all the projects. This as easy since the Web Map was already perfectly configured. Just drag in the Widget for Map and use the vertices to size it in the columns. Click on the map and on the right side, Select Map. To change the default view, click custom and then set the zoom and placement. There are also lots of other tool options to play with.
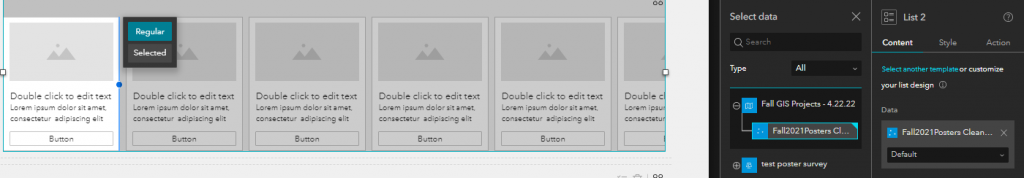
The next thing we did was start the gallery of projects. This is where we had the most issues. At first (since I was already on the gallery template), I edited the Card widget to showcase all our projects. HOWEVER, with this widget, you need to add them all 1 by 1 and with 200+ projects, i thought there HAD to be a better way! I FINALLY realized that the card widget is NOT what you want to use, but instead the LIST widget allows you to pull in all the projects in addition to filtering.
I added the List widget – and all went pretty smoothly from there. First, select the template and size your widget. Move the image and the text to where you want it. Then click Start. Under Select Data, choose the Web Map.
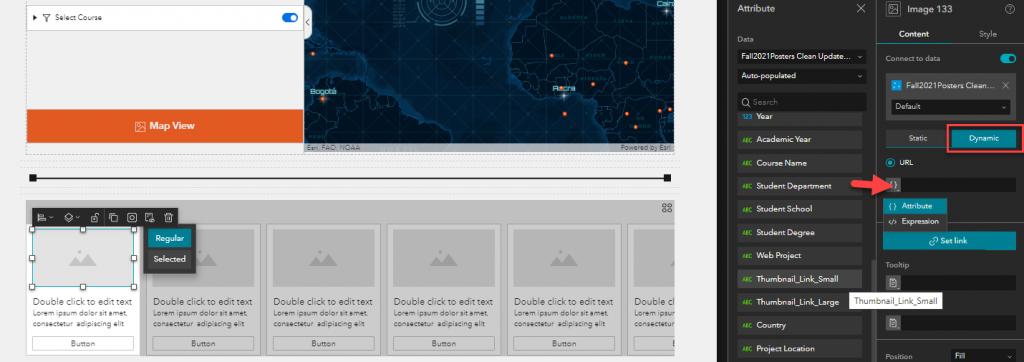
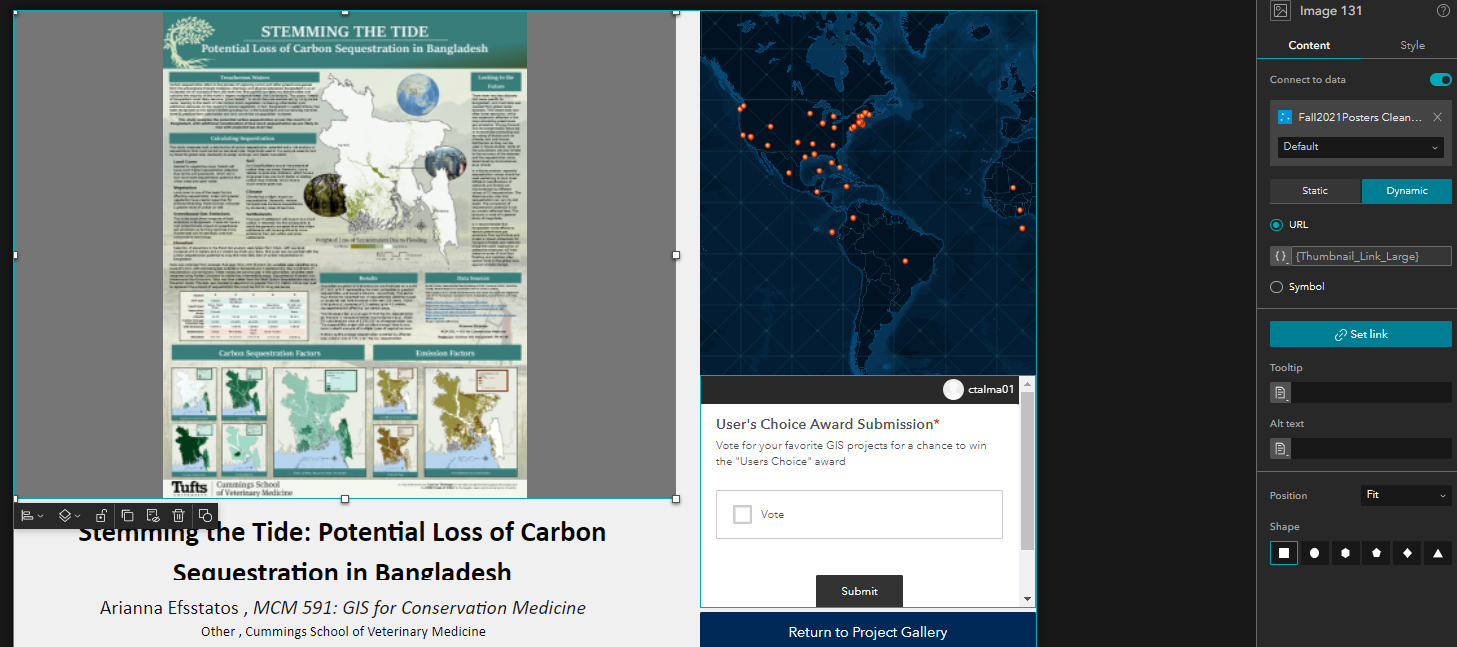
To autofill the projects, click on the image thumbnail in the widget. The toggle for Connect to Data should be on. Since our feature layer had an attribute field for project links and project thumbnails, i was able to set the widget to pull from the Project Thumbnails column for the images. To do so, set the tab to Dynamic and then Attribute. Select the field that holds the project thumbnails. This autofilled the list with all the projects!
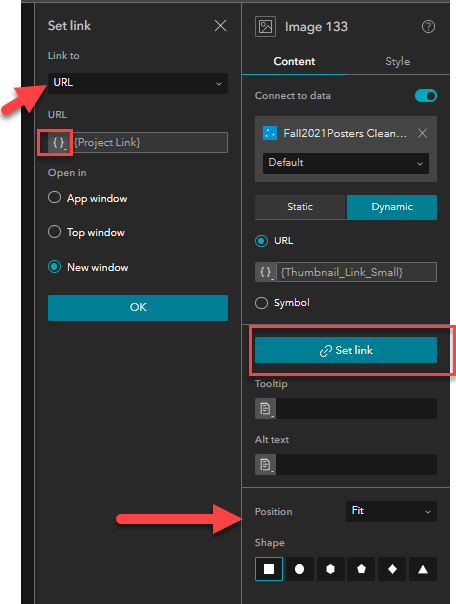
Lastly, while the image is selected, click Set Link.
Link to URL and then click the brackets and select attribute. Find the field that holds the URL for the project and set it to open in a new window.
Lastly, change the position from Fill to Fit so the whole thumbnail is in view.
You can save and preview throughout to see how it is coming along!
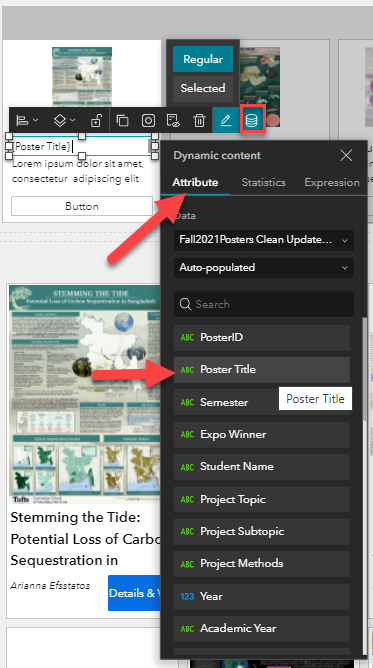
Now, the text in the List needs to be changed and made dynamic. This was trickier to find. What you need to do is select the text in the List, then press the little geodatabase icon that pops up. This will allow you to set the text to pull from a field in the attribute table. You can also style and arrange it here.
Lastly, we edited the button widget, which will eventually link to a project details page.
Making a Project Details Page
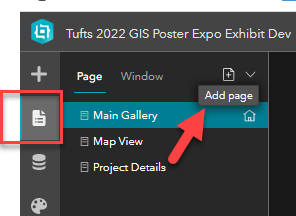
In this application, we wanted users to be able to click on a project and link to a page for more details. To do so, we added a new blank page.
We set up the page, this time actually using the Card widget! Pull in the card widget and arrange the size. Once again, go through the same steps of dynamically connecting the Thumbnail, project link and Poster Title/Author text to the correct fields in your data source.
We also wanted to have a Map on this page that showed the location of the selected project. This involved using two Triggers. I pulled in a Map widget and sized it in the top right. I also set it to connect to the same Web Map.
In order for the poster to be selected and the extent to change to zoom to said project, the trigger needs to be set on the Main Page List widget, not this Map widget. Go back to the Main Page and the List widget. Under the Action, select Add a Trigger. Set the first trigger to Filter the Map. Then set another Trigger to Zoom to Map.

Adding A Users Choice Upvote Button
This was by far the trickiest part. We really wanted users to be able to up-vote their favorite projects. After much trial and error, we decided to make a Survey123 because we saw there was a Survey123 Widget!
This survey has 2 questions. The first being a hidden question for the Poster Object ID. The 2nd question is a Multi-choice question with 1 option that just says Upvote.
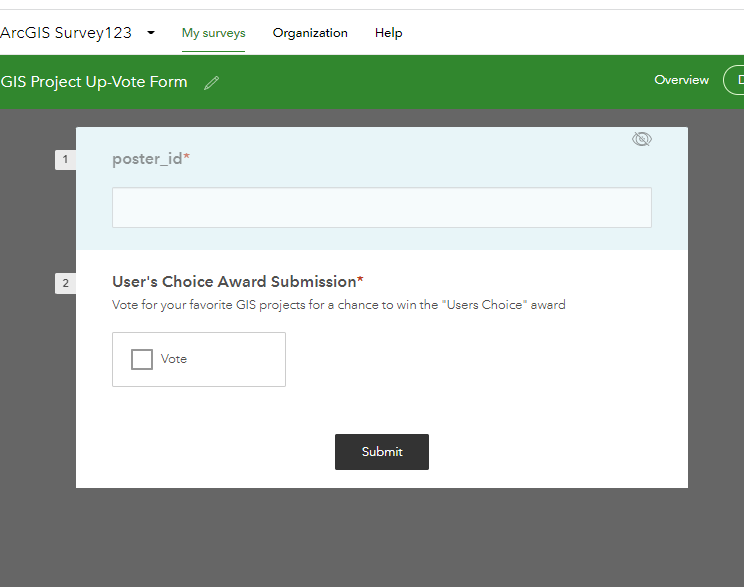
Then, what we did was in the CSV of the GIS projects, we added a Upvote Link column. We created an equation that concatenated the link to the survey + the Poster_ID field so that the hidden question was automatically populated. Then, users could be able to click Up Vote without seeing the details of the poster. Huzzah!
The downside to this approach was that since we figured this workflow out AFTER i’d already built the application with the original data, i needed to start over and reupload the CSV, make the web map, reconect all the widgets to the new web map. So, if you plan to do something similar, make the Upvote survey first and put it in your CSV before starting to build the application!
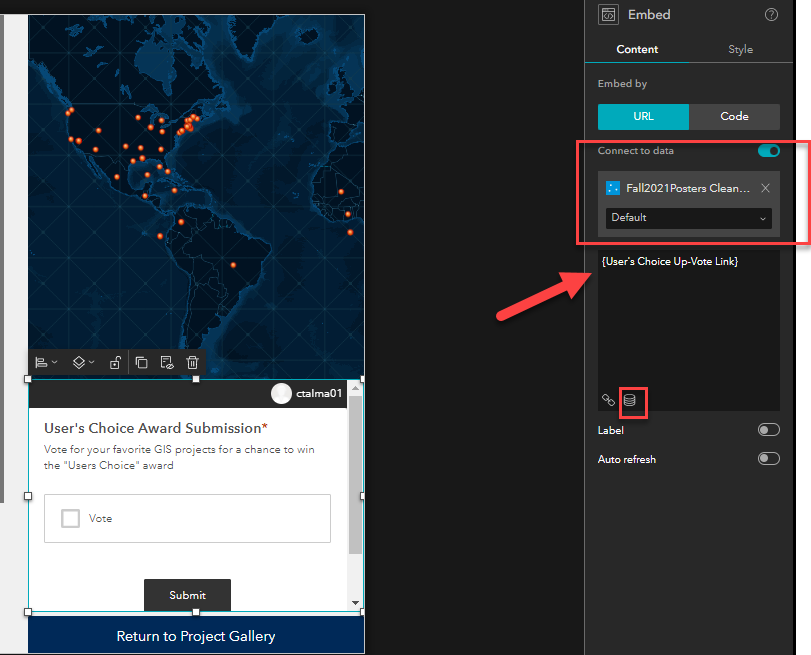
Now, our idea was to use the Survey123 Widget in the app. Unfortunately, that didn’t look as good as we hoped so we actually used the Embed widget to embed the survey. Same idea, different approach, worked better!
Once again, connect the widget to the NEW data source and set the field to be the Users Choice Survey Link. Voila! An upvote button in the application!
Final Details
The last few things we did was add some preset filters for GIS course, Project Topic, Web projects vs Posters, etc. We also added the search widget so people could search by name or poster titles.
We added a full page Map so that people could explore the map in more detail. This was all very straightforward after figuring out the List widget and the Survey123 upvote!
I also edited the feature layer to include info on the winners of our competition along with a link to a ribbon image. I added the image widget to the List widget and Card widget to identify the winners, which worked great. The down side to this was the posters that didn’t win a prize and were blank in that attribute displayed a little “image” icon in the app, so i needed to fill the field with an image. I literally linked to a white box so the user didn’t see anything but an image was there. Clunky, but functional ha.
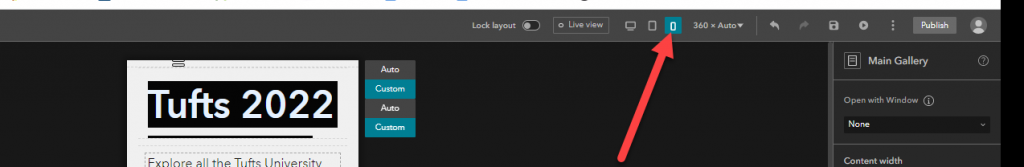
And LASTLY, dont forget to configure the tabs for cell phones and tablets! It’s a bit hidden, but they need to be done separately! And make sure to click customize before doing any other edits, or else they will change on the desktop view too!
Anyways! I hope this is helpful to all those hoping to build a similar application! Feel free to reach out with any questions: DataLab-Support@elist.tufts.edu
Cheers,
Carolyn Talmadge
Data Lab Services Manager | Research Technology
Tufts Technology Services | Tufts University


