For cities that are honest enough to count aviation at all, the aviation sector is a large fraction of greenhouse gas inventories.
For example, in Seattle’s official 2016 greenhouse gas inventory (.pdf), air transportation at the two airports is responsible for 1.25 million metric tons of carbon dioxide equivalent (CO2e) emissions (21% of all emissions). This represents a rapid increase from 2008, when air transportation was only 0.99 million metric tons CO2e (16% of all emissions).
Thus, in just 8 years, the fraction of Seattle’s emissions attributable to aviation jumped by more than 30% (increasing by 5 percentage points from 16% in 2008 to 21% in 2016 of all CO2e emissions).
In Seattle, air transportation grew from 16% of emissions in 2008 to 21% of emissions in 2016.
In light of such statistics, it requires some courage for cities to address aviation. Seattle’s 2013 Climate Action Plan in part deflects responsibility for the aviation sector: “Air travel is not a central focus of this Plan. Most of the actions to address aviation’s impact on the climate are beyond the reach of any individual city.” But, it does describe some small steps in reducing travel by city employees.
More importantly, in discussing what others are doing, Seattle lays out a vision that includes not only technology change and alternate fuels, but also changes in aviation demand: “Reducing unnecessary trips is a key strategy for reducing the impact of air travel on the climate. New communication technologies have the potential to optimize business travel, which is a significant source of air travel emissions.”
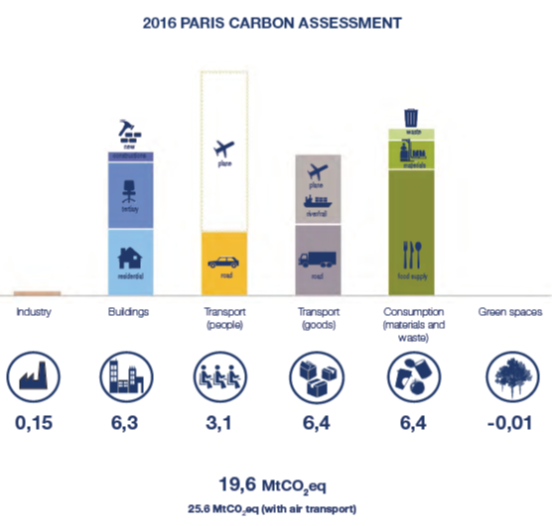
Like Seattle, the ambitious carbon neutrality plan for Paris recognizes the large contribution of aviation emissions. As with Seattle, one can see the pain that it causes city planners in Paris to address aviation, because the impact is so very large. If one excludes aviation transportation, the total emissions for Paris are 19.6 million metric tons CO2e. But when aviation is included, the total rises by 6 million tons to 25.6 million metric tons CO2e. Aviation is 23% of the total.
In Paris, air transportation is 23% of greenhouse gas emissions.
In communicating this impact, the chart below from the Paris plan strikes an understandable compromise, not hiding the aviation emissions, but not quite ready to include them in the official statistics (because, as with Seattle, city planners may in part attribute air transportation to forces beyond their control). So, quite reasonably, the chart provides the statistics a reader might need, with and without air transportation.
For city governments, seeking to report this issue correctly without overstating their own responsibility, a useful and balanced reference is the “Global Protocol for Community-Scale Greenhouse Gas Emission Inventories: An Accounting and Reporting Standard for Cities” (.pdf). This protocol notes that Intergovernmental Panel on Climate Change (IPCC) guidelines for national accounts require the reporting of both domestic and international air travel emissions, but they do not require countries to include the international air travel emissions in official totals. In other words, individual countries need not take full ownership of international air travel emissions, which are supposed to be addressed by a separate UN process, but it would be wrong for countries to hide or disguise these emissions. All air travel emissions still must be reported.
In the same spirit, the protocol for cities requires the inclusion of airborne trips within the geographic boundary (such as helicopters) and, importantly, “emissions from flights departing airports that serve the city.” The protocol recognizes some complexity, because not all flying at such airports is attributable to people from the city itself. A city’s emissions inventory can indicate whether the airport serves local, national, or international travelers. So long as transparency is maintained, the protocol says, “cities may report just the portion of scope 3 aviation emissions produced by travelers departing the city.” Just as in the Paris example, it might be understandable to exclude part of the airport’s air travel emissions from certain official tallies, so long as all emissions are reported clearly somewhere in public reports. The protocol says, “Cities shall transparently document the methods used in the inventory reports.”
In contrast with Seattle, Paris, and the protocol for cities, the Boston climate action plan hides the impact of aviation. With no justification, the methdology report (.pdf) states that it counts energy related emissions “not related to air travel.” The city’s web page boasts that Boston decreased total emissions by 4% from 2016 to 2017, without noting that the rapidly growing air travel sector was excluded. The Boston Green Ribbon Commission website gives a rosy picture of city progress. Its high-profile Carbon Free Boston report (.pdf) sets goals for most sectors other than air travel. The one-sentence comment on air travel is buried in the report: “Our analysis notably omits air travel at Logan airport and the consumption of goods and services.” We have requested by email further information on how air travel from Logan Airport may be counted at any future time, with no response. As noted above in the examples of Seattle, Paris, and the protocol for cities, one might understand that not all Logan Airport emissions would be included in all official tallies, but there is no basis for pretending the airport does not exist.
In Boston, with no justification, air transportation is excluded from greenhouse gas inventories. As a consequence, official statements on climate neutrality plans are misleading.
For cities, sensible protocols have been established for greenhouse gas inventories, which are used in monitoring and goal-setting in this time of climate crisis. For cities with the courage to look at this issue, aviation turns out to be responsible for a large fraction of total CO2e emissions, exceeding one fifth of emissions in major cities. Climate action plans and greenhouse gas inventories that hide aviation emissions, simply omitting them from public accounts as if they did not exist, fall short of accepted accounting standards and reasonable public expectations of honest reporting, harming serious efforts to address climate change.