Sample Project
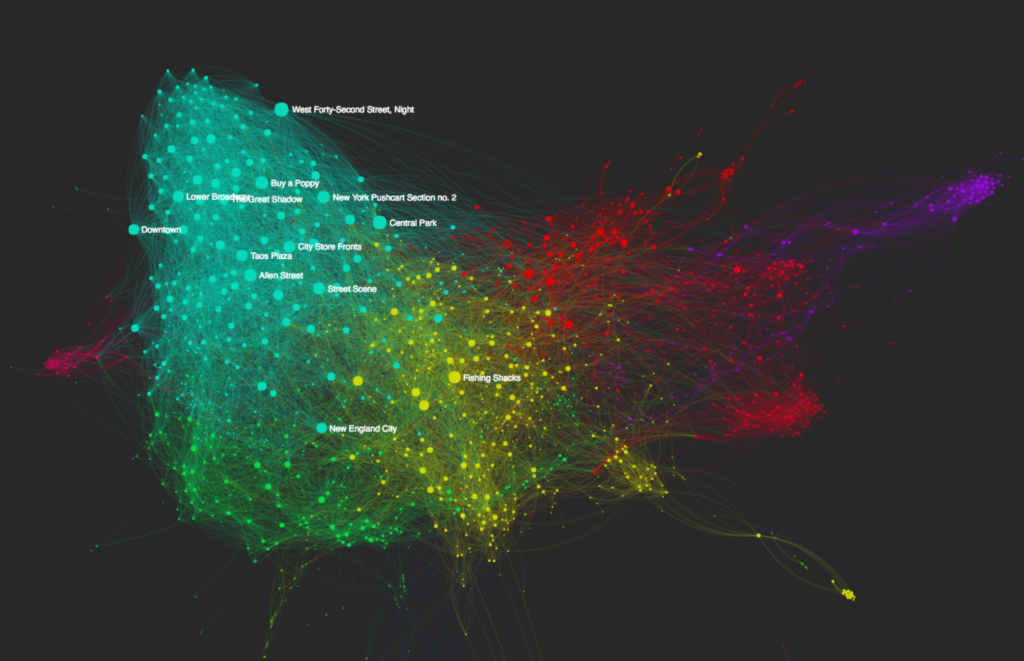
Networks of the Smithsonian American Art Museum by Matthew Lincoln
This project used Gephi to make a network map of thematic connections in artworks from the Smithsonian American Art Museum, made between 1900 and 1935.
Readings
Tools
- Gephi: A free, open source visualization tool for graphs and networks.
- Cytoscape: An open source software platform for visualizing complex networks and integrating these with any type of attribute data
- Palladio: A general-purpose suite of visualization and analytical tools
- TimelineJS: An open-source tool that enables anyone to build visually rich, interactive timelines
- D3.js: A JavaScript library for manipulating documents based on data.
- RawGraphs: An open source data visualization framework built with the goal of making the visual representation of complex data easy for everyone
- Text Analysis Portal for Research (TAPoR): a directory of visualization tools for text analysis
- Datavisualization.ch: A directory of selected visualization tools
Datasets
- DH Toychest: Datasets collected by Alan Liu
- US Government’s Open Data
- National Archive of Data on Arts & Culture
- Data is Plural, compiled by Jeremy Singer-Vine
- 1001 Datasets and Data Repositories, compiled by Ryan Anderson

