Sample Project
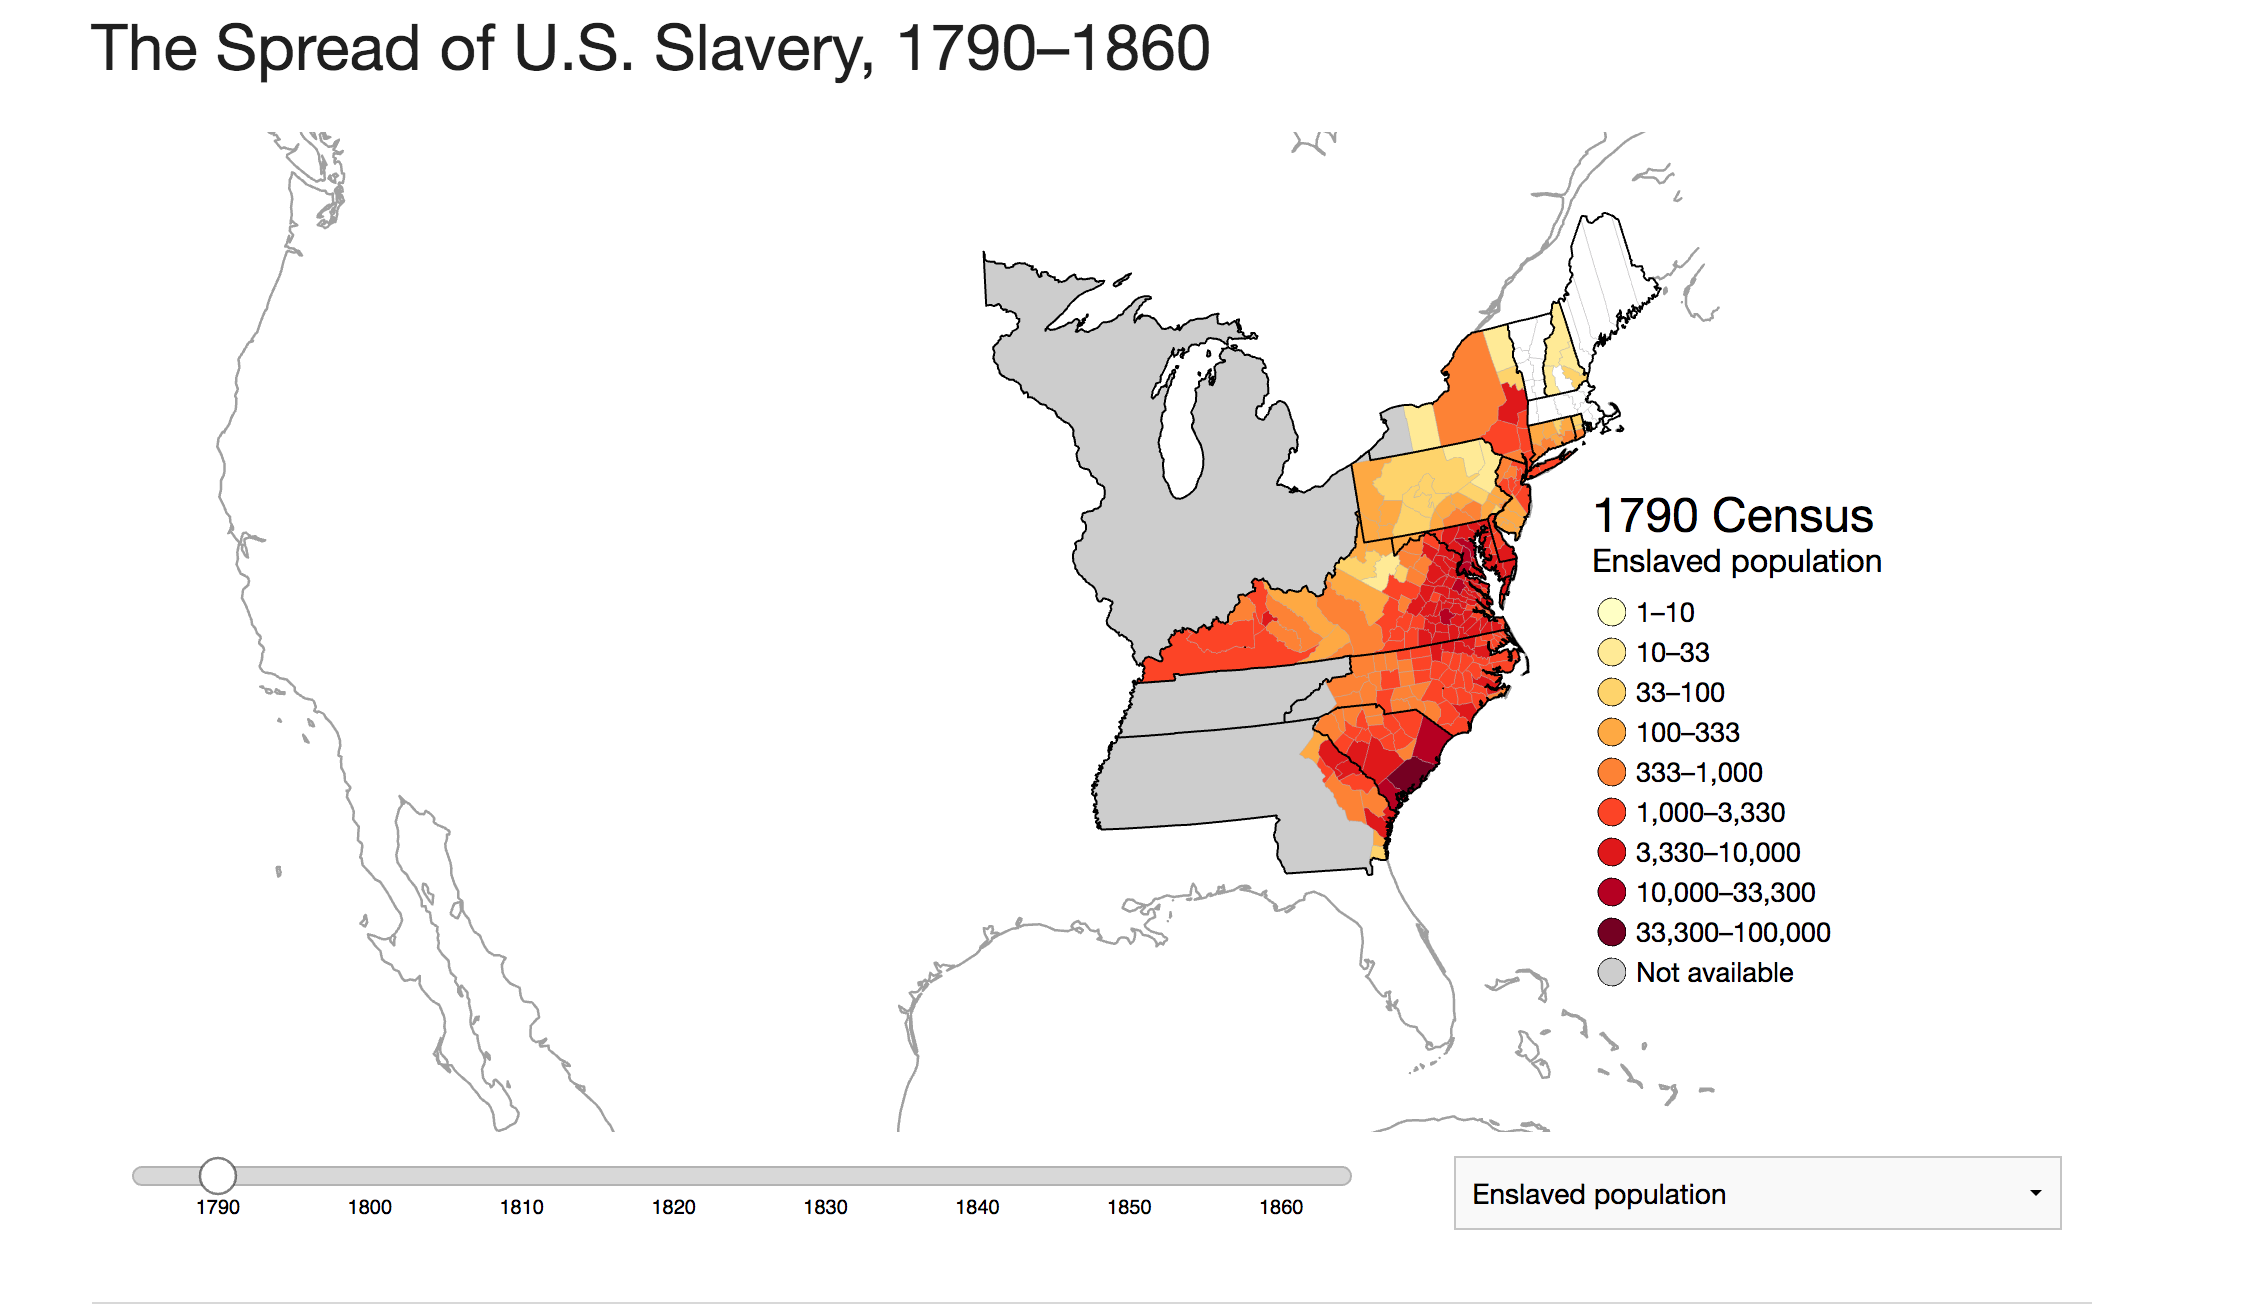
The Spread of US Slavery, 1790-1860, by Lincoln Mullen
This project is an interactive map of the spread of slavery in the United States from 1790 to 1860.
Readings
- “What is Spatial History?” by Richard White
- “What is the Spatial Turn?” by Jo Guldi
- “Introduction” from Lincoln Mullen’s Spatial History Workshop
- Scholars’ Lab’s Zotero collection on Humanities GIS
Sample Datasets
- Digital Atlas of Roman and Medieval Civilizations: a collection of maps and databases pertaining to Roman and Medieval civilizations
- National Historical Geographic Information System (NHGIS): includes population, housing, agricultural, and economic data, along with GIS-compatible boundary files, for geographic units in the United States from 1790 to the present.
- Pleiades: a community-built gazetteer and graph of ancient places that publishes authoritative information about ancient places and spaces
- Trans-Atlantic Slave Trade Database: contains details on 35,941 voyages involving the Trans-Atlantic slave trade
For more datasets, visit the directory of GIS datasets at GIS at Tufts.
Historical Maps
- Boston Public Library’s Norman B. Leventhal Map Center: historical map collection of thousands of maps, including some georeferenced maps
- David Rumsey Map Collection: historical map collection of over 82,000 maps and images from the 16th through 21st century from around the world.
- Old Maps Online: an index of over 400,000 historical maps from around the world
- USGS topoView: a collection of historical topographic maps from the US Geological Survey
Tools
- ArcGIS StoryMaps: enables users to combine maps with narrative, images, and multimedia content
- Leaflet: an open-source JavaScript library for mobile-friendly interactive maps
- Map Warper: a free, open-source map warper, georectifier, and image georeferencer
- Neatline: an Omeka plugin that allows users to tell stories with maps and narration through hand-crafted, interactive spatial and temporal interpretation
- QGIS: a free, open-source Geographic Information System
- Social Explorer: Visually explore demographic data
For additional tools, see the tools directory for DataLab at Tufts and the DiRT Directory Geospatial Listing.
Tutorials
GIS at Tufts
Are you at Tufts, and do you have a geospatial humanities project in mind? Make sure to look at the websites for GIS at Tufts and the Data Lab!