Method
There are many methods to studying obesity and the NF-kB signaling pathway. One in particular examined how NF-kB activity changed during a 12 week feeding period in rats. By comparing feeding habits of a high-fat diet (HFD) and a low-fat diet (LFD) and examining the subjects via in-vivo imaging, the NF-kB levels can be tracked.
In previous research, NF-kB has been genetically engineered to control binding of luciferase transgene in reporter mice. Luciferase transgene causes luminescence, allowing the mice to glow when imaged appropriately. This luciferase gene is controlled by 3 NF-kB DNA-binding sites (26). These binding sites are set-up in a way that is identical to a light chain promoter. The light chain promoter refers to the promoter region for immunoglobulin kappa light chain in antibodies and is referenced here primarily for its structure (27). Based on the mechanism of the light chain promoter, the genetic engineering behind luciferase transgene binding can be inferred as shown below (28):
Image created based on the light chain promoter described in Lernbecher, Muller, and Wirth. (28)
Luciferase transgene is controlled by deoxyribonucleic acid (DNA) binding sites in the NF-kB signaling pathway and “directly reflects NF-κB transactivation” (26). Thus, using luciferase luminescence for in-vivo imaging is a very tangible method to observe NF-kB presence in mice (26).
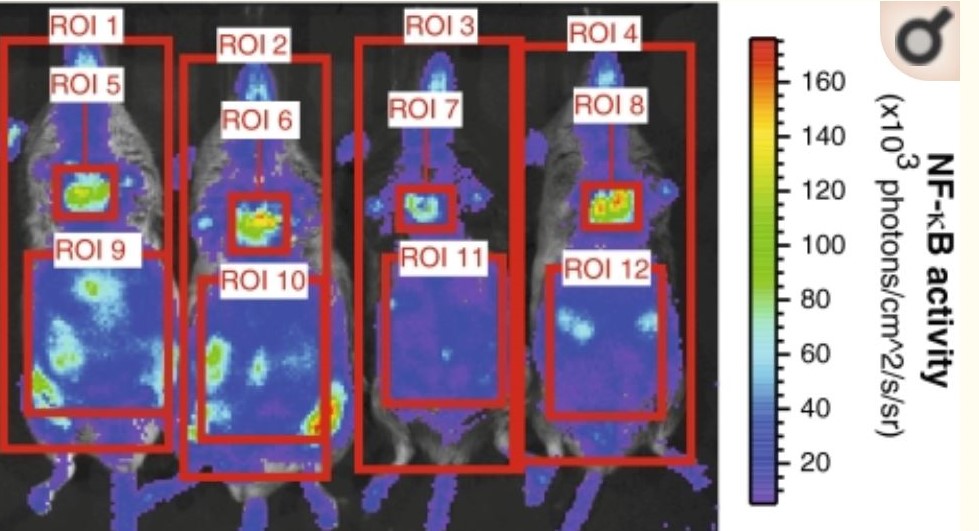
Figure taken from Carlsen et al. (26)
By observing NF-kB luminescence through in-vivo imaging, the NF-kB activity can be quantified and chronologically assessed (i.e. when does increased NF-kB activity occur in the pathway and where does it occur). Also, in-vivo imagining can show whether or not there is a correlation between NF-kB activity and inflammation. This method is explored in more detail in “Paper 1” under Recent Studies.
Recent Comments