A Short Overview of The Poincaré Institute Impact on Teaching and Learning
Please go to the end of this report for a list of downloadable published papers.
The Poincaré Institute courses started in 2011 and have served, across four cohorts of teachers, over 240 educators and their students in ten partner school districts across New England. Research reveals the positive impact of the program on classroom teaching and learning, and on student results on standardized tests.
Changes in classroom teaching
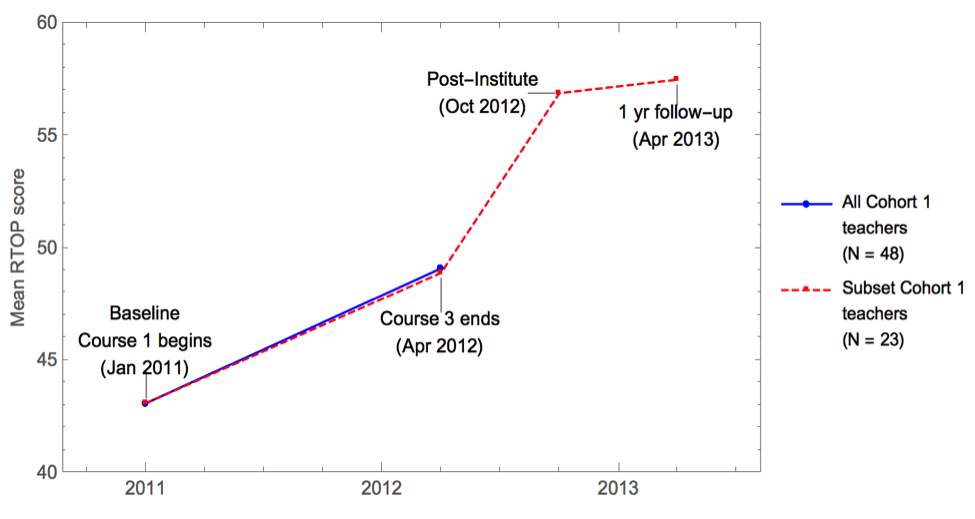
External evaluators used the Reformed Teaching Observation Protocol (RTOP) to examine teachers’ learning practices by observing classroom lessons chosen by each of 48 participating teachers in a cohort, one lesson at the start of the program and another at the end of the three courses. They also observed a sub-sample of 23 of these teachers in follow-up visits, six months and a year after program completion. The following graph summarizes the results.
Figure 1: Mean RTOP scores for the first cohort at beginning and end of courses, and for a sub-group of 23 teachers, six months and a year later (source: INCRE, External Evaluation).
The total mean RTOP score for the 48 teachers at the start (January 2011) and at the end of the program (April 2012) increased from 43.1 to 49.1, a significant mean increase of 6.0 points (p<.05) and an effect size of .30. The mean RTOP ratings for the 23 teachers, observed six months and a year after the end of course 3, increased from 43.1 in January 2011 to 57.5 in April 2013, an increase of 14.4 points (p<.01) and an effect-size of .69.
These results suggest that participation in the program had an enduring effect on the teachers’ instructional practices. Teachers explained, in interviews conducted by the external evaluators, that after the program ended they were better able to put into practice what they had learned in planning their lesson. This would explain the dramatic improvement six months after concluding the program.
Changes in student learning
We analyzed changes, from 2011 to 2014 in the percentage of Proficient and Advanced students of grades 5 to 8 in the Massachusetts Comprehensive Assessment System (MCAS) test, given at the end of each academic year to students in grades 5 to 8. Each of five Massachusetts target districts was matched to five comparison districts with similar number of students, similar demographic characteristics, and similar MCAS results in the 2010-2011 school year. The graph below shows the evolving percentage of students classified at the Advanced and Proficient levels in the state, the target, and the comparison districts.
Figure 2: Percent of students at the MCAS test Advanced and Proficient levels.
At the start of the program (Spring of 2001), the overall percentage of students at the Proficient and Advanced levels in the target districts were nearly identical to those of comparison districts (47.9% vs. 48.0%). Three years later, the target districts had surpassed comparison districts by 4.5 points and had narrowed the gap with regard to the state from 7.1 to 4.5 percentage points
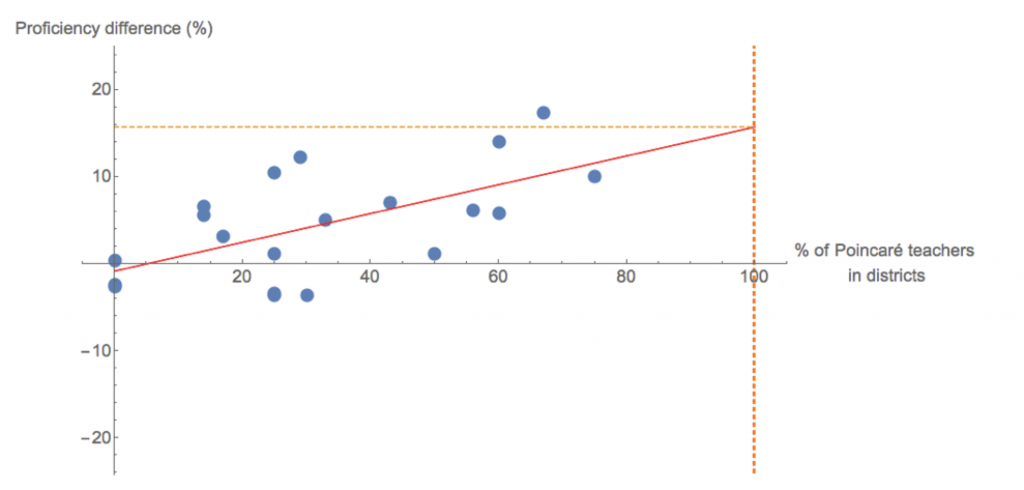
The next graph displays the difference in changes (y-axis), from year 2010-2011 to year 2013-2014, for each grade level in each of the target districts, vis-à-vis the average of corresponding comparison districts, as a function of the percentage of teachers (x-axis). Each point corresponds to the percentage of teachers’ participation and the percentage difference in student achievement in each of the grades, in each district.
Figure 3: Target districts’ advantage in 2014 over similar districts, as a function of percentage of teachers who completed the program. Each point represents one of four grade levels in five different districts (two points are hidden by other points).
When the percentage of participating teachers is above 30%, the points are all above the x-axis, signifying that the target districts outperformed the comparison districts. Moreover, the greater the percentage of participating teachers in a district, the better the relative gains of the target district. This is reflected in the upward slant of the regression line and the significant Spearman correlation of r =.57, (p=.0045), which suggests that the teacher development program played a role in the improved performance of students in the target districts.
Addressing the achievement gap
From August 2015 to December 2016, the program enrolled 53 elementary, middle, and high school teachers of mathematics and 10 special education or enrichment teachers from a target district in the Greater Boston Area, with a large proportion of African American and Hispanic-Latino students. They constituted 44% of the elementary and middle school educators in the district.
Student results for the school year were measured by the Partnership for Assessment of Readiness for College and Careers (PARCC, the state mandated state test at the time). We compared changes in student achievement in the target district from June 2015 (before teachers entered the program) to June of 2016 (when teachers had finished the second course in the program) to changes in 10 similar comparison school districts serving as control group. The 10 comparison districts were similar to the target districts in terms of percentages of students at the highest levels of PARCC’s achievement in mathematics (levels 4 and 5) in 2014-2015, demographic characteristics of the districts and student population, and teacher qualification.
PARCC’s results are reported as percentages of students classified at each of five performance levels, in each grade level, in each district. The five levels are: L1 – Did Not Yet Meet Expectations, L2 – Partially Met Expectations, L3 – Approached Expectations, L4 – Met Expectations, and L5 – Exceeded Expectations. We determined the average performance levels by districts and analyzed shifts in performance from the 2014-2015 to the 2015-2016 school year.
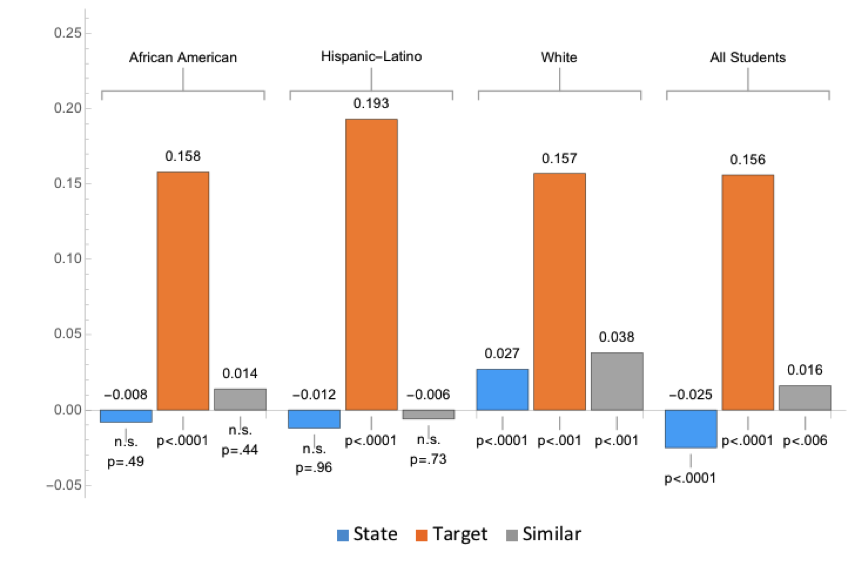
The figure below shows changes in PARCC’s average performance level of students in grades 3 to 8, for African American, Hispanic-Latino, White students, and All students, in the target district, in the whole state of Massachusetts, and in the comparison districts.
In the target district, all students, as well as each ethnic group, improved significantly more (≥ 0.156) than students in the state or similar districts (≤ |0.038|).
African-American (+0.158) and Hispanic/Latino students (+0.193) in the target district showed more improvement than the White students (+0.157), indicating that the achievement gap in the target district is narrowing (more for Hispanic-Latino students than for the African Americans).
In the state and similar districts, White students are still showing more improvement (≥ +0.027) than African-American and Hispanic/Latino students (≤ |0.014|), an indication that, different from the target district, the achievement gap is not narrowing.
Figure 4: Changes in average performance over one school year
Published Papers
The documents distributed here have been provided as a means to ensure timely dissemination of scholarly and technical work on a noncommercial basis. Copyright and all rights therein are maintained by the authors or by other copyright holders, notwithstanding that they have offered their works here electronically. It is understood that all persons copying this information will adhere to the terms and constraints invoked by each author’s copyright. These works may not be reposted without the explicit permission of the copyright holder.
2021
Schliemann, A.D., Carraher, D.W., & Teixidor-i-Bigas (2021). Teacher Development Structured Around Reasoning About Functions. International Journal of Science and Mathematics Education. https://doi.org/10.1007/s10763-021-10169-y
2019
Schliemann, A.D., Hotomski, M., Carraher, D.W., & Teixidor-i-Bigas (2018). Teacher Development and Mathematics performance of Ethnic groups. Unpublished research report. The Poincaré Institute, Tufts University, Medford, MA.
Carraher, D.W. & Schliemann, A.D. (2019). Early algebraic thinking and the US mathematics standards for grades K to 5 / El pensamiento algebraico temprano y los estándares matemáticos en la Educación Primaria (6–12 años) en Estados Unidos, Infancia y Aprendizaje, DOI: 10.1080/02103702.2019.1638570
2018
Schliemann, A.D., Carraher, D.W., & Teixidor-i-Bigas (2018). Poincaré Institute: Course Descriptions and Impact on Teachers and Students. Unpublished research report. The Poincaré Institute, Tufts University, Medford, MA.
2017
Liu, C. & Carraher, D. (2017). Teachers’ Interpretations of a Linear Equation Regarding Physical Quantities. NCTM Research Conference, San Antonio, TX, April 3-5.
Liu, C., Schliemann, A.D., Carraher, D.W. & Teixidor-i-Bigas, M. (2017). How Teachers Interpret Equations and Graphs in terms of Situations. NCTM Research Conference, San Antonio, TX, April 3-5.
Schliemann, A.D., Liu, C. Carraher,D.W., & Teixidor-i-Bigas (2017). Understanding Operations on Quantities. NCTM Research Conference, San Antonio, TX, April 3-5.
2016
Caddle, M., Bautista, A., Brizuela, B. M., & Sharpe, S. (2016). Evaluating mathematics teachers’ professional development motivations and needs. Journal of Research in Mathematics Education/Revista de Investigación en Didáctica de las Matemáticas (REDIMAT), 5(2), 112-134. doi:10.4471/redimat.2016.2093
Hotomski, M. & Schliemann, A.D. (2016). Teacher Development and the Achievement Gap.
Liu, C., Teixidor-i-Bigas, M., & Schliemann, A.D. (2016). Teachers’ Quantitative Reasoning When Using Graphs.
Schliemann, A.D., Carraher, D.W., & Teixidor-i-Bigas, M (2016). Teacher Development and Student Learning. Invited Presentation. 13th International Congress on Mathematical Education. Hamburg, Germany, July, 25-30.
Sharpe, S., & Schliemann, A. (in press). Teacher Development and 7th Graders’ Learning of Algebra. The Mathematics Enthusiast, 14(1).
Wilkerson-Jerde, M., Bautista, A., Tobin, R., Brizuela, B. M., & Cao, Y. (2016). More than Meets the Eye: Patterns and Shifts in Middle School Mathematics Teachers’ Descriptions of Models. Journal of Mathematics Teacher Education, 19(2-3).
2015
Bautista, A., Cañadas, M. C., Brizuela, B. M., & Schliemann, A. D. (2015). Examining How Teachers Use Graphs to Teach Mathematics in a Professional Development Program. Journal of Education and Training Studies, 3(2), 91-106
Sharpe, S., & Schliemann, A. (2015). Algebra Notation for Functions in Grades 5 through 9. In Bartell, T. G., Bieda, K. N., Putnam, R. T., Bradfield, K., & Dominguez, H. (Eds.). (2015). Proceedings of the 37th annual meeting of the North American Chapter of the International Group for the Psychology of Mathematics Education. East Lansing, MI: Michigan State University.
2014
Bautista, A., Brizuela, B. M., Glennie, C., & Caddle, M. (2014). Mathematics teachers attending and responding to students’ thinking: Diverse paths across diverse assignments. International Journal for Mathematics Teaching and Learning. July Volume (28 pages). Retrieved from http://www.cimt.plymouth.ac.uk/journal/bautista.pdf
Bautista, A., Wilkerson-Jerde, M. H., Tobin, R. G., & Brizuela, B. M. (2014). Mathematics teachers’ ideas about mathematical models: A diverse landscape. PNA, 9(1), 1-28.
Sharpe, S., & Schliemann, A. (2014). The Impact of a Teacher Development Program on 7th Graders’ Learning of Algebra. In Nicol, C., Oesterle, S., Liljedahl, P., & Allan, D. (Eds.) Proceedings of the Joint Meeting 5 – 161 of PME 38 and PME-NA 36,Vol. 5, pp. 161-168. Vancouver, Canada: PME.
2013
Bautista, A., Brizuela, B. M., & Ko, Y.-Y. (2013). Middle school mathematics teachers’ implicit conceptions about multiple representations for functions. In D. Halkias (Ed.), Psychology and the Search for Certainty in Everyday Life (pp. 31-48). Athens: ATINER.
Bautista, A., Wilkerson-Jerde, M. H., Tobin, R., & Brizuela, B. M. (2013). Diversity In Middle School Mathematics Teachers’ Ideas About Mathematical Models: The Role Of Educational Background. In B. Ubuz, Ç. Haser, & M. A. Mariotti (Eds.), Proceedings of the 8th Congress of the European Society for Research in Mathematics Education [CERME] (pp. 960-969). Ankara, Turkey: Middle East Technical University.
Teixidor-i-Bigas, M., Carraher, D. W. & Schliemann, A. D. (2013). Integrating Disciplinary Perspectives: The Poincaré Institute for Mathematics Education. The Mathematics Enthusiast, 10(3), 519-561.
Save


