
Danny Tobin, UNDP Uganda

Outputs of the Internship
- Modelbuilder tutorial (how to automate GIS work), Steps of creating GCF geodatabase, Jupyter Notebooks Tutorial, QGIS tutorial, ArcGIS Photo Story Tutorial, ODK set up information, and Python resources
- Folders on the Ministry computers with clipped wetland information for every district in Uganda
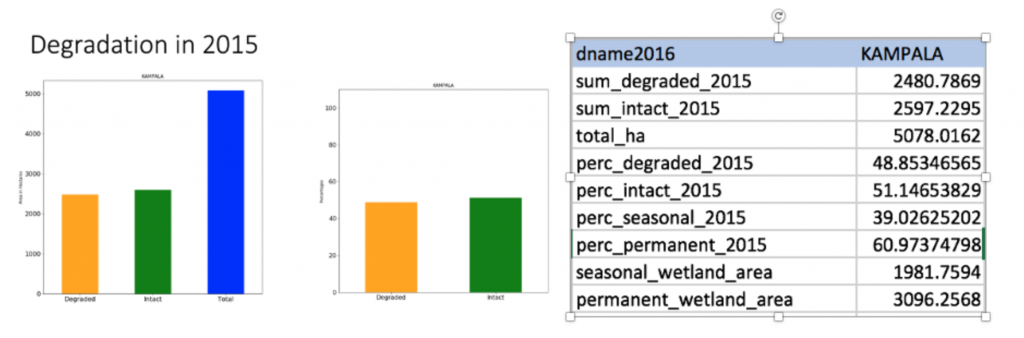
- Folders for every district with 6 types of graphs and tables showing wetland information such as percent degradation, hectares degraded, and seasonality (see example of Kampala on next slides)
- Geodatabase with relevant wetlands, districts, and year 1 intervention sites for the project
- ODK rapid assessment form and back end google drive folder
Output examples: Data Analysis by District
Output Examples: Clipped Wetland information

Output Example: GCF Geodatabase

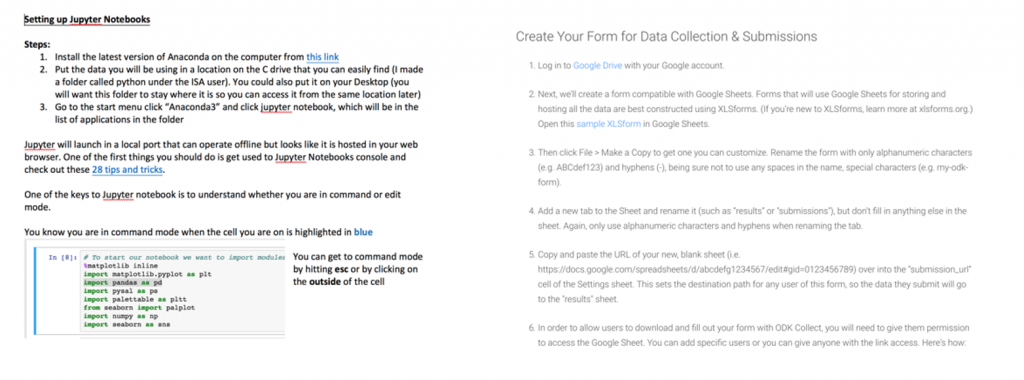
Output Example: ODK – front and back end

Vision Moving Forward – Data recommendations by Danny and Asadhu
Data Collection – ODK
- ODK can make wetland field work more accurate and less time-intensive by automating data entry
- The system operates as an app on android phones or tablets and sends completed forms to google drive.
- Any wetland inventory sheet could now be filled out via ODK and be inputted easily into NWIS for up-to-date information
Using the Data
Once captured, data from ODK surveys can be used to showcase work on ArcGIS story tours, plot data on GIS, monitor field agents and guide decision-making on where to rehabilitate wetlands
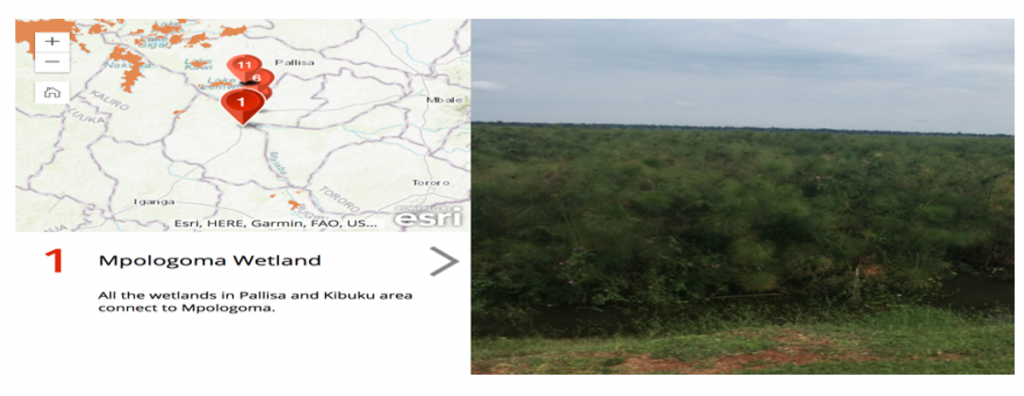
Photo Tours can be shared easily with a simple link and can show photos of the wetlands linked to geographic points and information about the sites. A Photo Tour showing before and after images of the wetlands could be a unique way to show the success of the project
See my example photo tour: https://arcg.is/1Km0O5
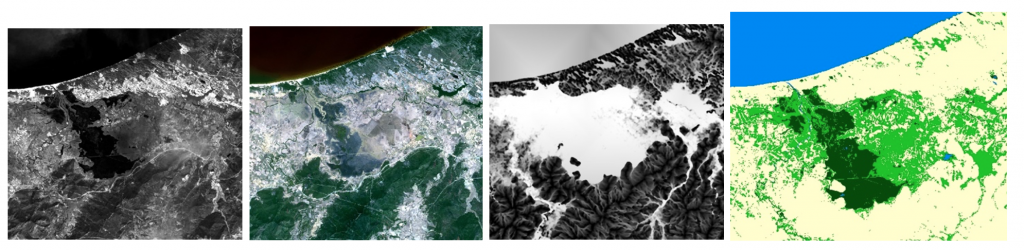
Data Collection – GlobAfrica Toolbox
Remote sensing capacity-building is necessary to improve the speed and ease of wetland inventorying. Remote sensing can be used to conduct wetland inventories from the office by using satellite imagery. While this system will still require some field visits for validation and to gather supplementary information, it can drastically cut costs of inventory and give some useful information on hydrology, health of the wetlands, etc. Using either GlobAfrica Toolbox (developed by the EU using QGIS) or another type of remote sensing software will enable more frequent inventories of wetland extent.
GlobAfrica Toolbox inputs a satellite image and outputs a shapefile showing areas with the highest probability of being a wetland
Data Management and Plotting
With ODK-located intervention sites, shapefiles generated from past wetland inventories and UBOS demographic data, we can accurately show where we want to design interventions. We can then see how these sites relate to proximate wetland conditions and the well-being of the surrounding communities
Data for M&E and Demonstration of Impact
Comparing Similar Wetlands, Comparing Similar Parishes. We want to measure how different branches of the wetland with similar initial characteristics respond to the intervention
By comparing the livelihoods of two communities where one will receive training and the other will not we can see how livelihoods improved their wellbeing
Using this combined database we can precisely demonstrate the impact of this project. There are several methods of impact evaluation, but it is best to conduct an initial baseline survey, randomly assign interventions within the study area, and then conduct an endline (and intermediate survey) to gauge how effective the intervention has been.
Data for M&E and Demonstration of Impact
With time and limited resources, we will have to make decisions about where to restore first and which areas will not be targeted by this project.
If we identify all possible sites beforehand and plan interventions in advance we can compare similar communities or similar wetland branches where one has been restored and one has not. By doing so, we can attribute the changes in the community and/or wetland to our project and demonstrate the impact of the intervention.
Data Analysis
Analyzing the data we collect will continue to enhance planning and the effectiveness of wetland management. By looking at different measures of degradation, we can prioritize where to intervene and understand why degradation is occurring
By geolocating the data, we can compare wetland degradation across districts, parishes, and sub-counties to investigate where degradation is fastest, most extensive (in terms of area), or most pervasive (in terms of percentage of the total wetland area degraded). We can also compare to national trends and averages (see below).
Finally, data analysis can reveal unexpected patterns in the data that can prompt further investigation. For instance, what was working in Rubanda?
Data for Decision-Making
The data analysis that we can conduct with available information can show rates of degradation, extent of degradation, and different wetland classes, but it cannot guide prioritization by itself
By pairing this information with demographic data from UBOS and conducting stakeholder interviews to understand which areas are most critical, we can evaluate which are the most urgent areas to restore (and areas where community buy-in would be highest)
Data Integration – NWIS
By revitalizing NWIS and linking it with data collected by other departments like rainfall data, water flow data, vulnerability data, and agriculture, data decision-makers will be empowered to more precisely develop responses to challenges in diverse areas of the country
Data Sharing and Broader Impact
While the Government will retain control of the data, NWIS was designed to permit data-users at the district and community-level to view and work with data that is relevant to them, thereby improving the ease and effectiveness of decentralized governance, research, and consultancy services.
Recommendations
- Procure a consultant to gather a clean baseline dataset on the total potential intervention hectares out of which we can select 64,000 for the project
- Have the consultant list all possible intervention sites with accompanying ecological, socio-demographic, and geographic attributes that would enable prioritization of action based on a clear criteria
- Implement
ODK for all field visits by the consultant and regional staff such that central
wetland officers can track progress and easily locate sites
- Train with World Vision staff who are already familiar with the software
- Use ODK to create an initial ArcGIS photo story of the selected districts and wetland sites to market and showcase the GCF project to future donors and the general public
- Evaluate remote sensing software for wetland inventorying and pilot use of remote sensing during the project (this could possibly be GlobAfrica Toolbox or another software, but support is needed to decide on the software, train staff, and begin using it for data collection)
- Revamp
NWIS so that is a functional repository of wetland data, train staff to use
NWIS, and link NWIS to data in other departments and Ministries to enable
multi-disciplinary, multi-sectoral decision-making
- Hire a NWIS administrator to manage data input, data sharing, and data integration with other sources
- Train multiple staff in remote sensing, NWIS, and GIS so that institutional knowledge is maintained at the Ministry when there is personnel turnover
- Gather qualitative data on the ecosystem services generated by each wetland and their value to communities in order to use the Kampala matrix or another management criteria
- Train staff in data management and analysis such that data can be maintained, organized and used effectively – I piloted use of python in Jupyter Notebooks, but data analysis can be done in a variety of platforms including R and STATA
- Request up-to-date parish level data from UBOS for the 20 GCF districts on land use (types of agriculture and other activities), occupation, population, property rights, income or poverty rate, major agricultural products to enable impact evaluation
- Merge this data with wetland locations and with existing ecological information that can be taken from wetland shapefiles
- Add PMU intern for GIS and data management to guarantee access and progress on data