This page includes information on getting starting with ArcGIS Desktop products (ArcMap and ArcGIS Pro) along with tutorials written for other ESRI platforms such as ArcGIS Online, ESRI StoryMaps, Survey123 for ArcGIS, Experience Builder, and more…
ArcGIS Pro & ArcMap Tutorials
Getting Started with ArcGIS Desktop Tutorials
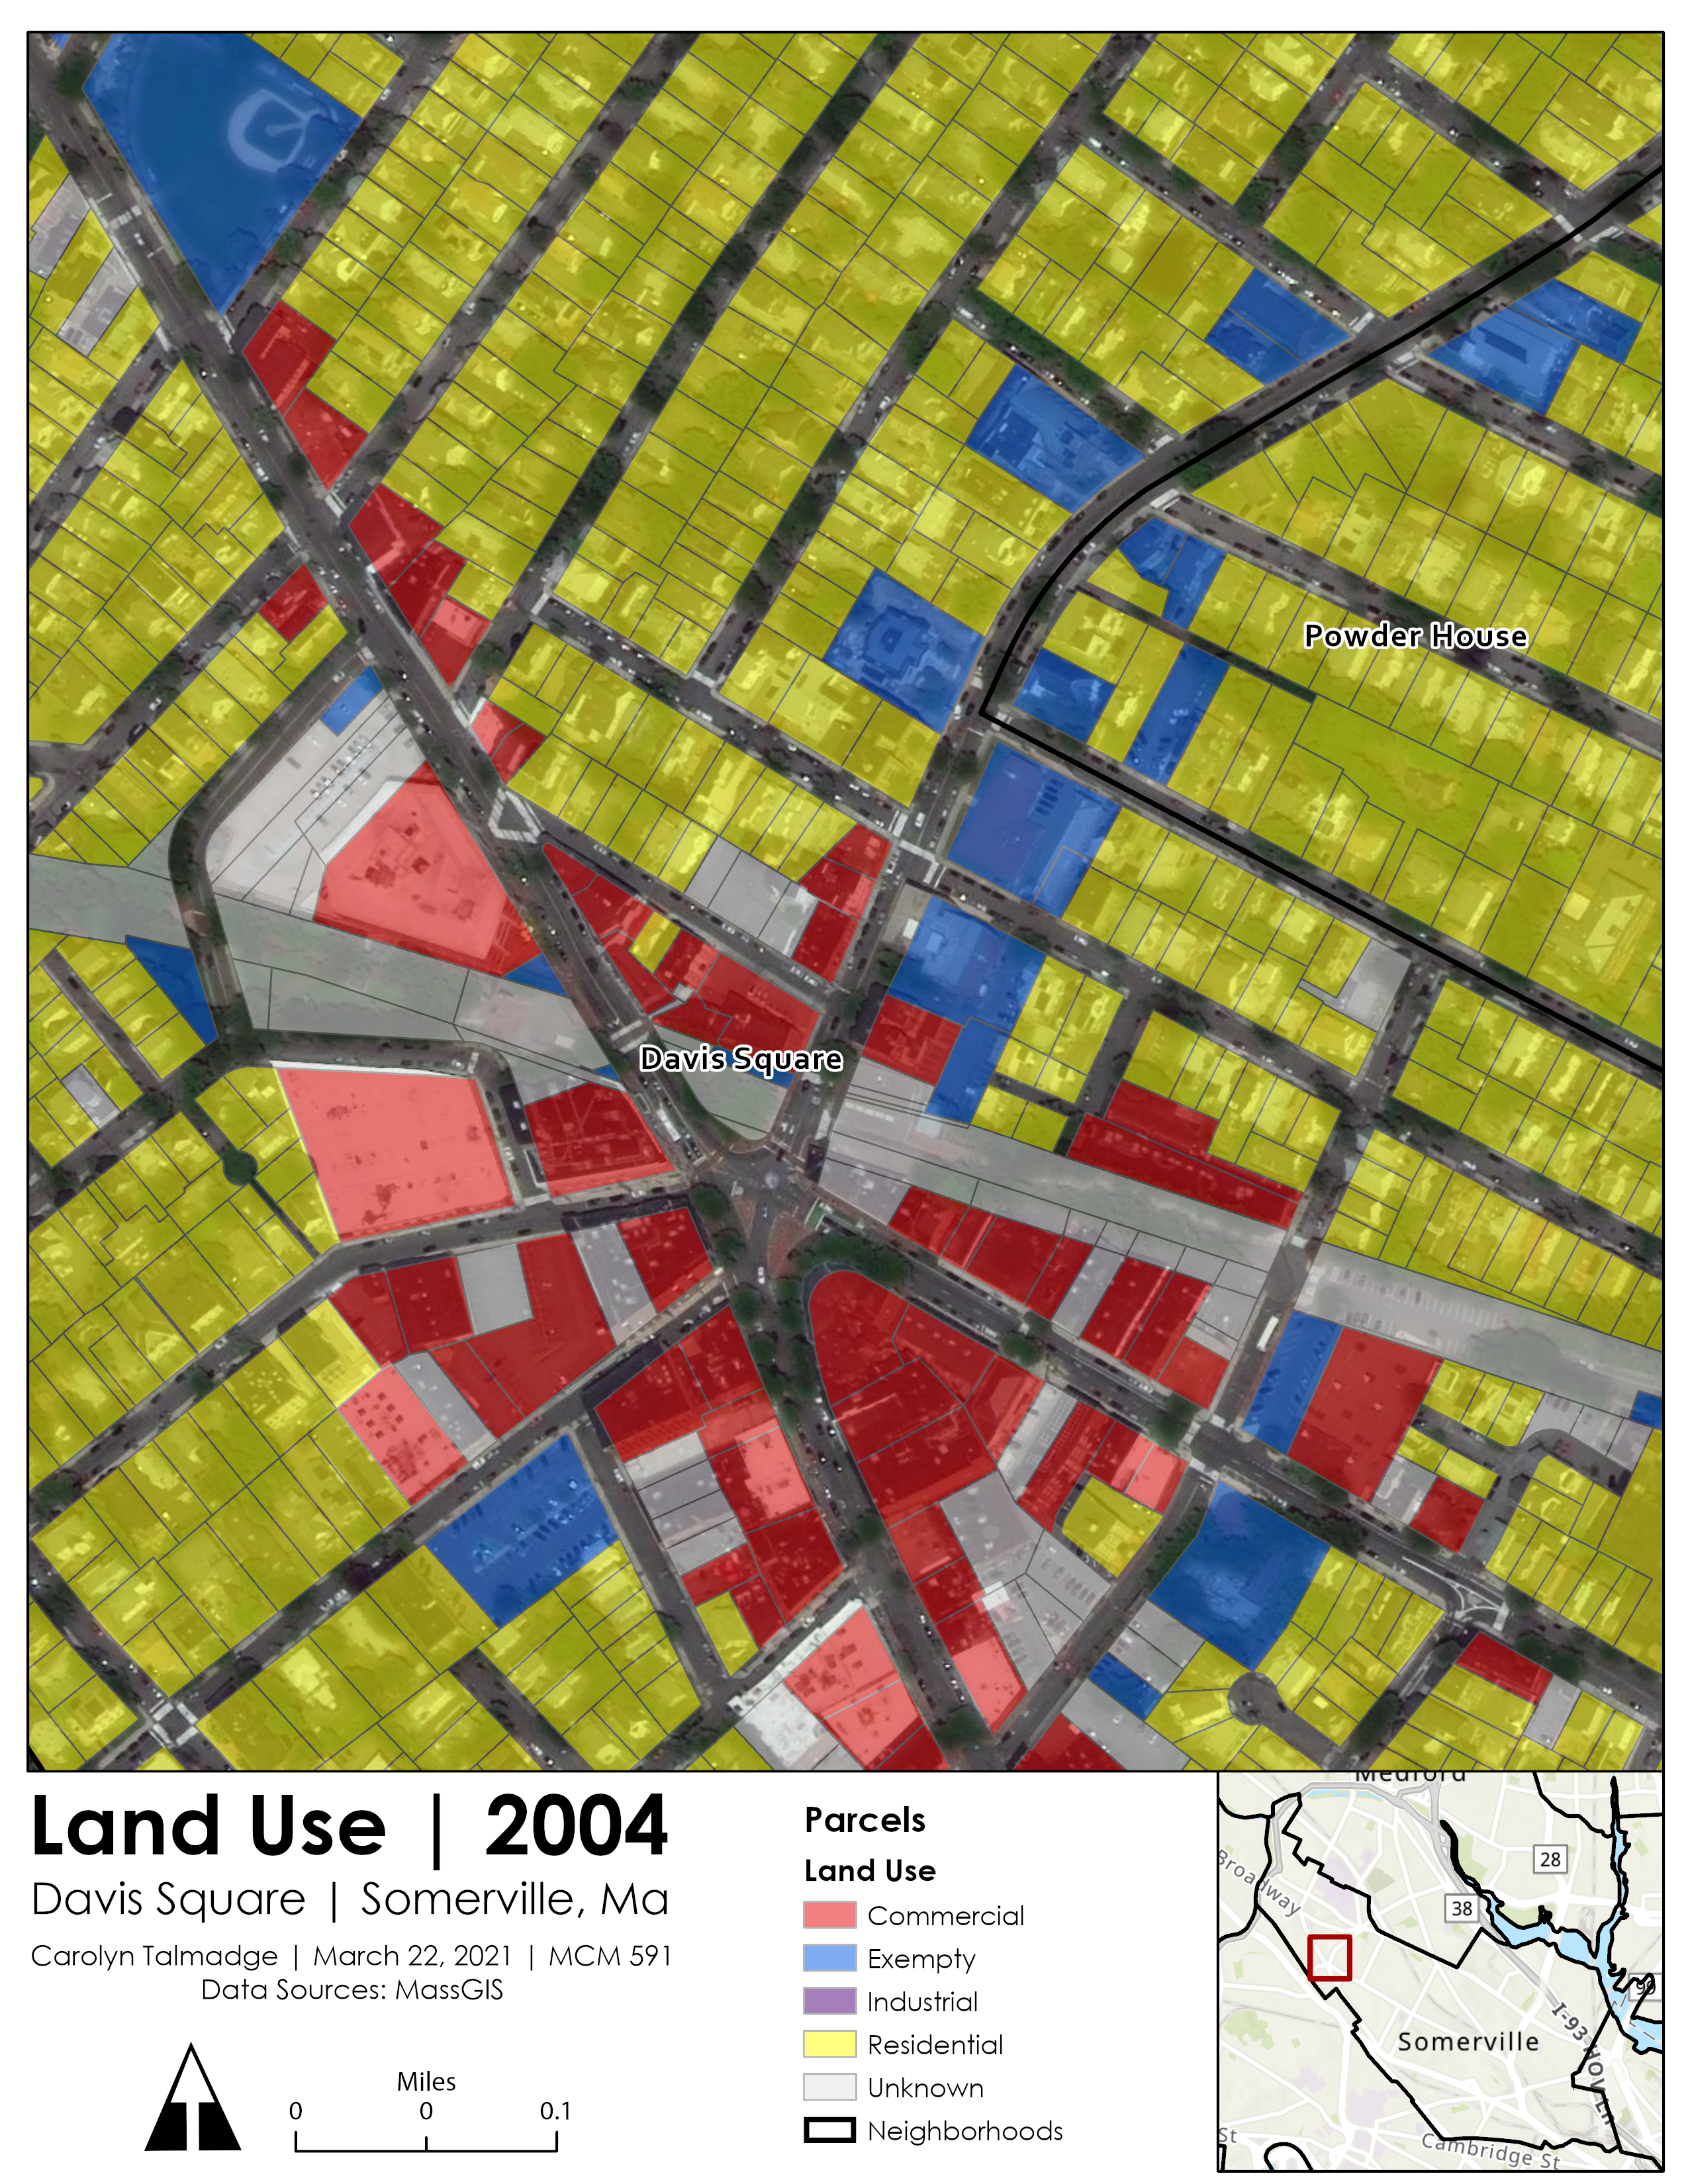
ArcGIS Basics – Somerville Land Use
Learn the Basics of ArcGIS by mapping Somerville, Massachusetts data from MassGIS. Learn how to symbolize data by unique values, label features, set a projection, create a locator map, and create a final map layout for export.
This tutorial takes approximately 2–3 hours to complete.
- ArcGIS Pro Tutorial: ArcGIS Pro Basics: Somerville (Version 2.6)
- ArcMap Tutorial: ArcGIS Basics: Somerville (Version 10.8)
- Download Tutorial Data
ArcGIS Basics – India
Learn the Basics of ArcGIS by mapping large and small-scale demographic data in India and Kolkata. Learn how to symbolize data by quantities, select by attribute and location, label features, set a projection, create a locator map, and create a final map layout for export.
This tutorial takes approximately 3–4 hours to complete.
- ArcGIS Pro Tutorial:
- ArcGIS Pro Basics: India (Version 3.1.4) – Short version
- ArcGIS Pro Basics: India (Version 2.6) – Extended tutorial with Selections activities
- ArcMap Tutorial: ArcGIS Basics: India Tutorial (Version 10.8)
- Download Tutorial Data
ArcGIS Basics: Examining the Link between Human Epidemic Status & Cases of Yaws in Primates – Africa, 2013
Learn the basics of ArcGIS by mapping cases of Yaws in Africa by country and by primate outbreaks. Compare the outbreaks to primate habitats. This tutorial will cover symbolizing categorical and quantitative data, selecting by attributes, setting a projection, labeling features, creating a locator map, and creating two final map layouts for export.
This tutorial takes approximately 2–3 hours to complete.
- ArcGIS Pro Tutorial: ArcGIS Basics: Yaws in Africa (Version 3.1.4)
- ArcMap Tutorial: ArcGIS Basics: Yaws in Africa (Version 10.8.1)
- Download Tutorial Data
Attribute Table & Selection Tools
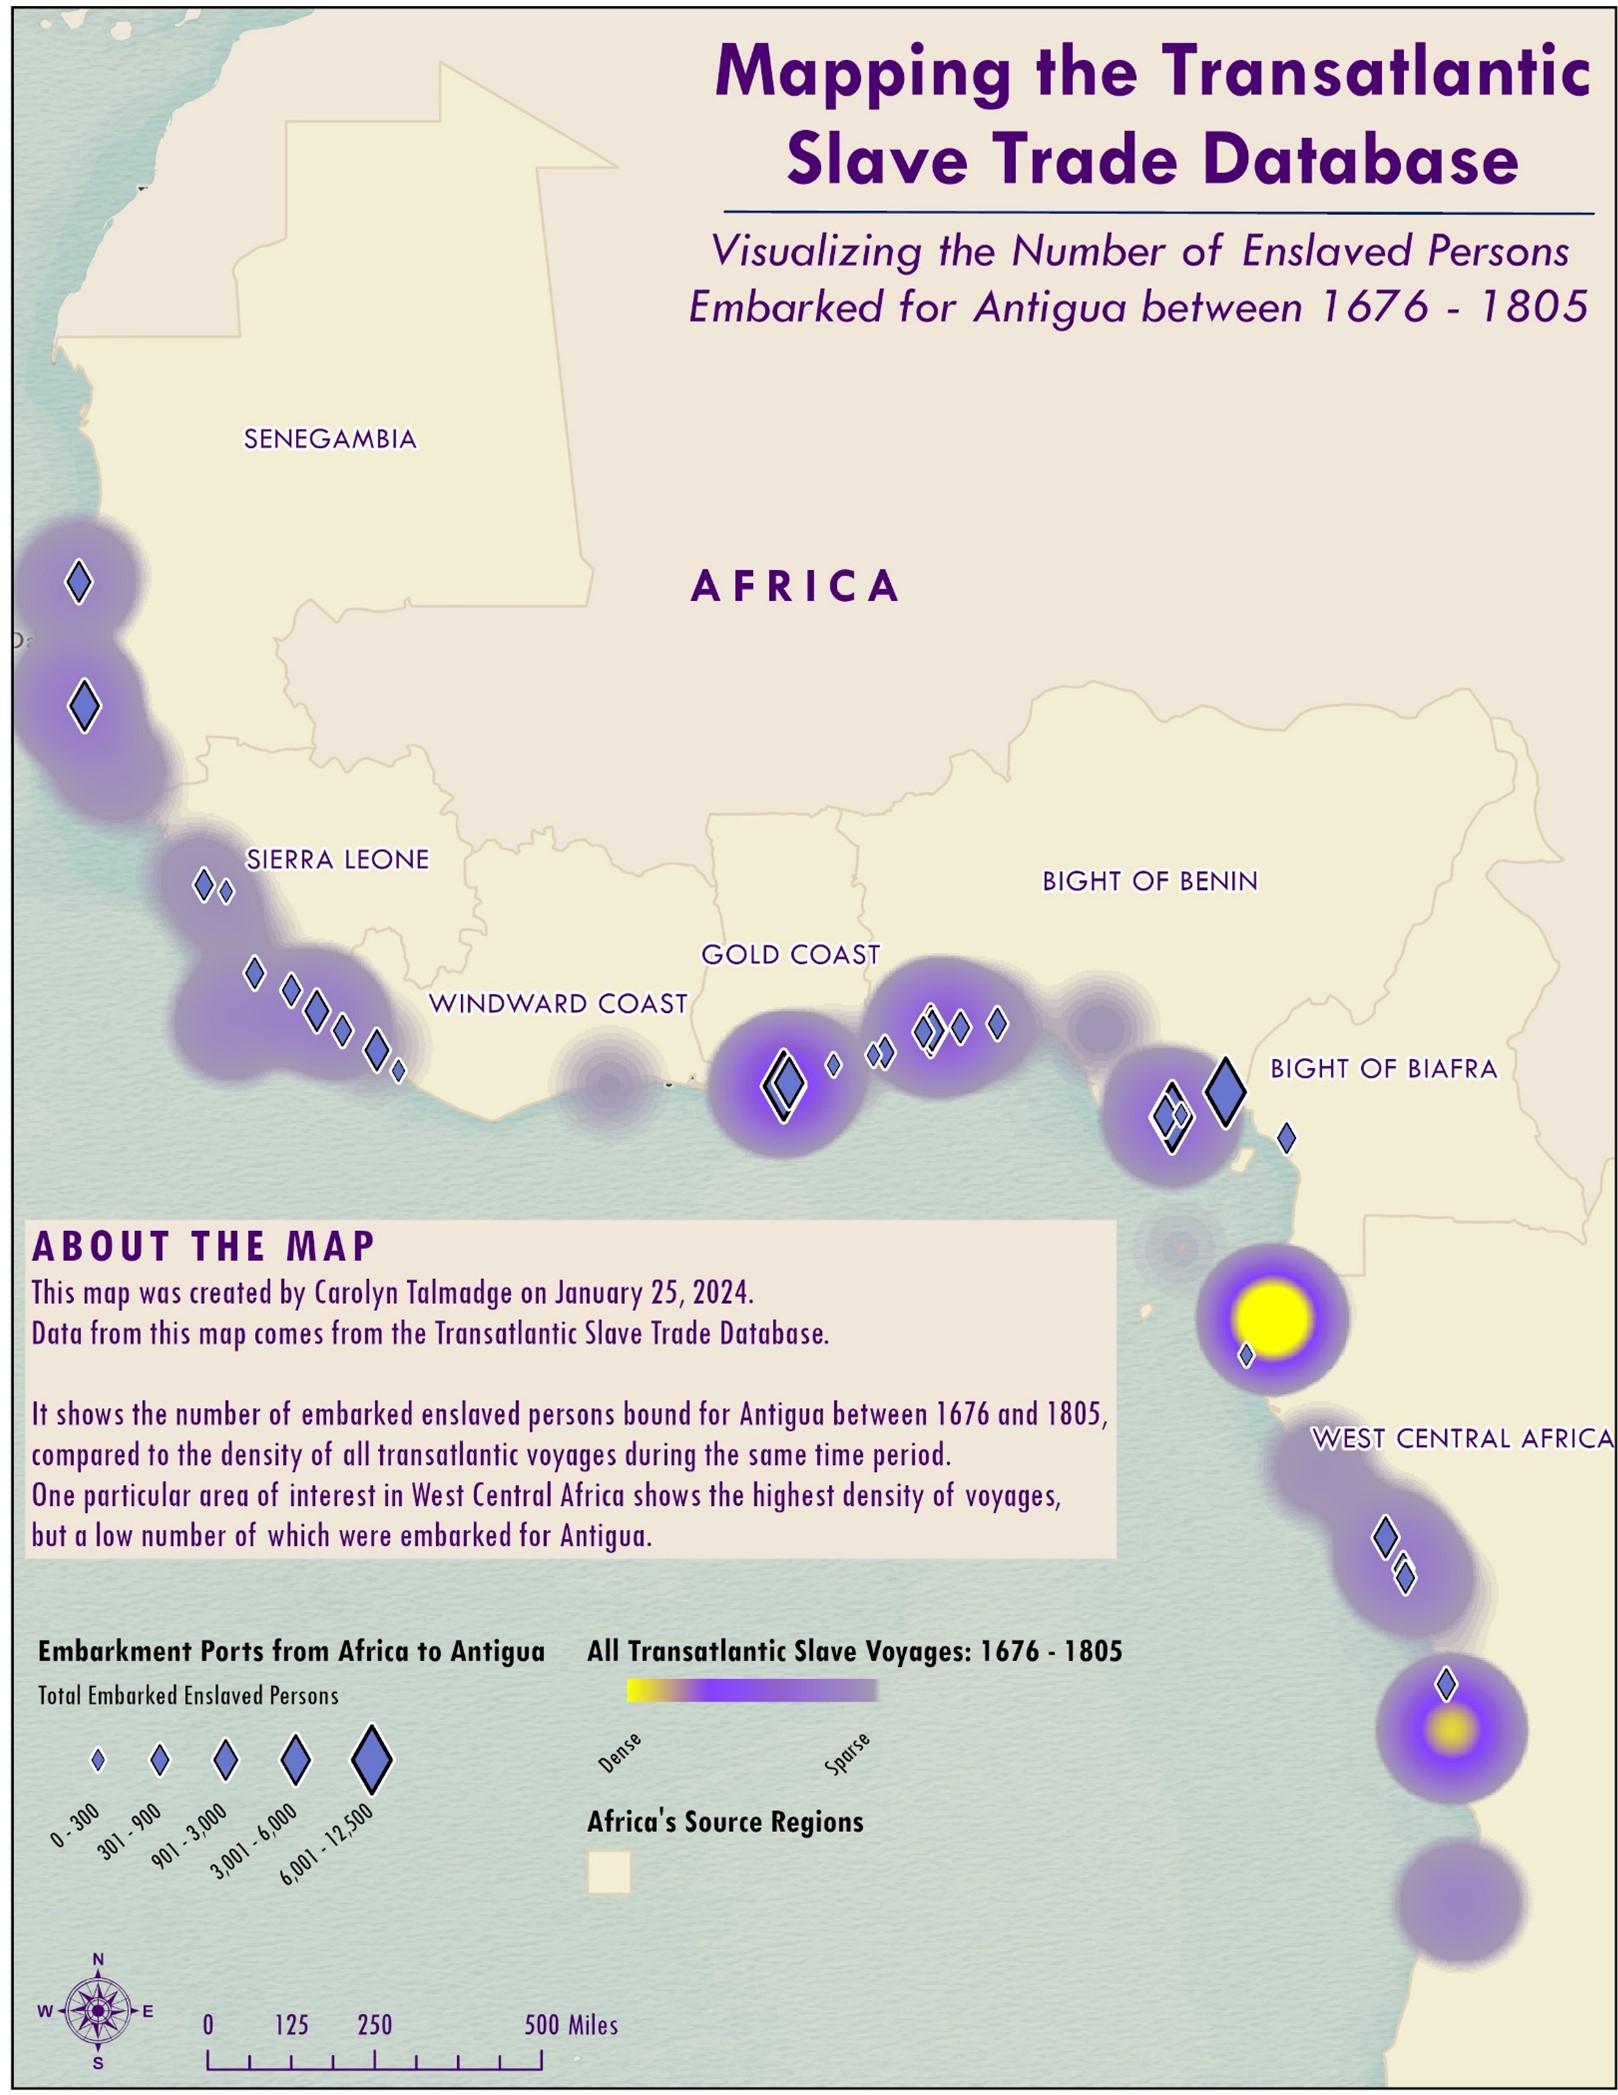
ArcGIS Pro: Selections and Queries: Mapping the Transatlantic Slave Trade Database: 1676 – 1805
This GIS tutorial will lead you through the steps in ArcGIS Pro to create a thematic map of transatlantic slave embarkment ports in Africa between 1676 and 1805. This tutorial will cover adding data to ArcGIS Pro, symbolizing categorical and quantitative data, select by attributes and select by location, attribute table tools, and composing a final map layout.
This tutorial takes approximately 2 hours to complete.
- ArcGIS Pro Tutorial (Version 3.1.4): Selections and Queries Mapping the Transatlantic Slave Trade Database: 1676 – 1805
- Data can also be downloaded here
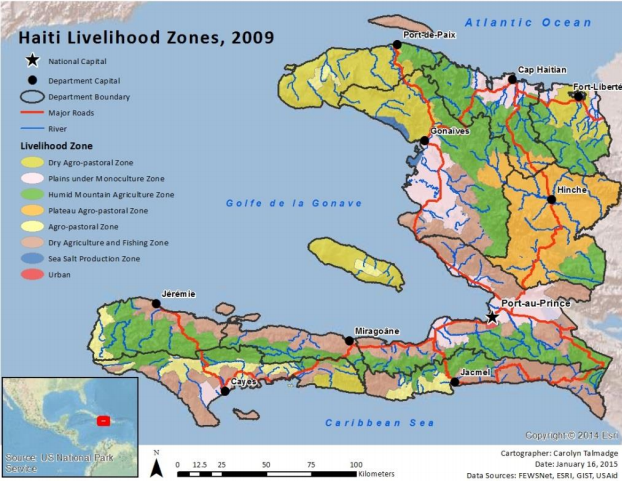
Basic Mapping & Cartography Exercise – Haiti
This short tutorial focuses on mapping unique categorical values showing livelihood zones in Haiti. It also introduces users to the select-by-attributes query tools, labeling features, inserting a locator map, and creating a final map layout.
This tutorial takes approximately 1 hour to complete.
- ArcGIS Pro Tutorial: Basic Queries Exercise – Haiti
- ArcMap Tutorial: Basic Mapping Exercise – Haiti Livelihood Zones
- Data can also be downloaded here: Basic Mapping-Haiti Livelihood Zones-Data
Basic Queries Exercise – Haiti
This tutorial teaches different selection tools, including Select by Attributes and Select by Location, in addition to attribute table functions. It also introduces students to spatial joins and zonal statistics tools.
This tutorial takes approximately 1.5 hours to complete.
- ArcGIS Pro Tutorial: Basic Queries Exercise – Haiti
- ArcMap Tutorial: Basic Queries Exercise – Haiti
- Data can also be downloaded here: Basic Query Practice Data

Using the Selection Tools for Querying
With this tip sheet, you will understand how to use selection tools for fundamental basic queries and analysis with Select by Attribute and Select by Location. You will also learn how to view statistics for select records.
- ArcMap Tutorial: Using the Selection Tools for Querying
Selection and Attribute Table Tip Sheets
- Viewing Statistics and Summarizing Data in ArcMap
- Adding a Field to the Attribute Table and Using Field Calculator in ArcMap
- Calculating Area, Perimeter and Length in ArcMap
- Fixing Problems with Numeric & Text Fields using the Field Calculator in ArcMap
Joins, Relates & Spatial Joins
Working with Census Data & Joins
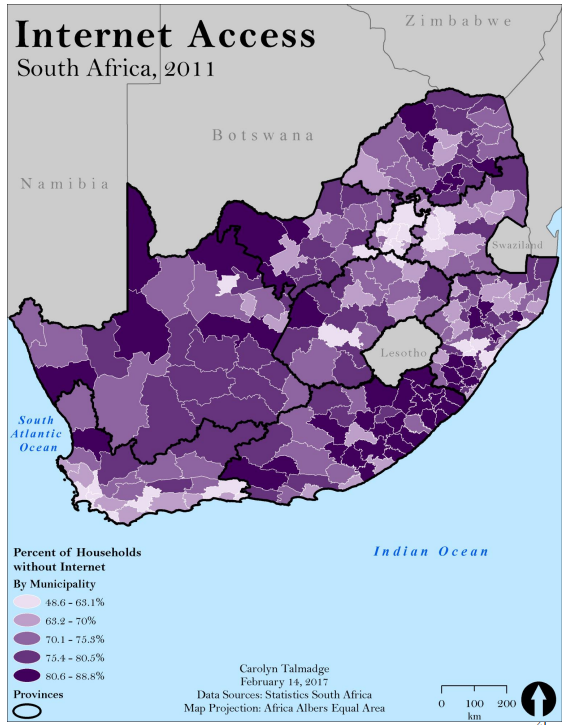
Downloading, Joining, and Mapping International Census Data – South African Census Tutorial
This tutorial covers how to access and download South African census data. It teaches how to clean and join the Excel data to administrative boundaries. Students symbolize quantitative data, review attribute table tools like field calculators and statistics, and create a final map layout.
This tutorial takes approximately 2–3 hours.
- ArcGIS Pro Tutorial: International Census: Downloading, Joining & Mapping South African Census Data
- ArcMap Tutorial: International Census Tutorial
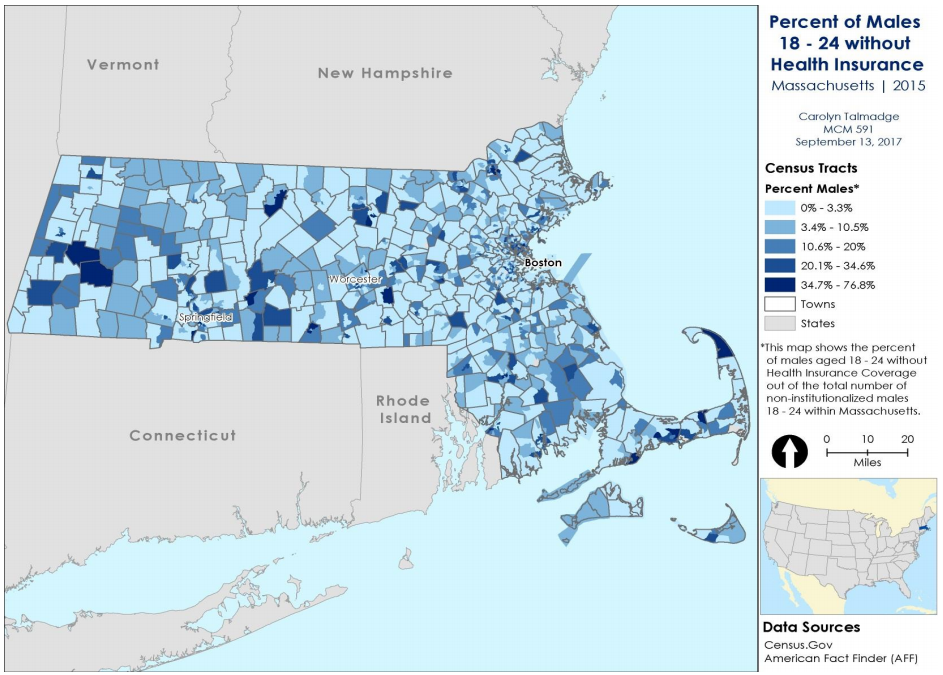
US Census: Downloading data from the Census & Joining ACS Health Insurance Data
This tutorial teaches students how to access and download health care insurance census data for Massachusetts from the US Census Bureau website. It also covers cleaning Excel data, joining data to census tracts, field calculator, labeling features, and creating a nice final layout.
This tutorial takes approximately 2–3 hours to complete.
- ArcGIS Pro Tutorial (Version 3.1.4) : USA Census Tutorial: Downloading data from the Census & Joining ACS Health Insurance Data
- ArcMap Tutorial (Version 10.8.2): USA Census Tutorial: Joining Healthcare Census Data

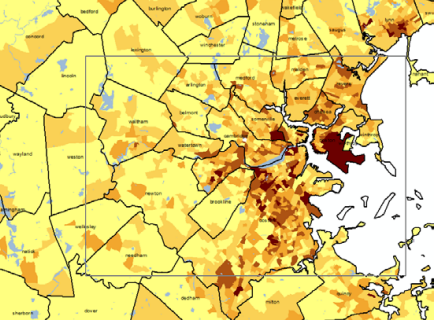
Downloading and Joining Housing Demographic Data in Boston, MA – USA Census Tutorial
This tutorial teaches students how to access and download the US Census Bureau website’s housing demographic data for Boston, Massachusetts. It also covers cleaning Excel data, joining data to census tracts, field calculator, formatting and labeling features, and creating a nice final layout.
This tutorial takes approximately 2–3 hours to complete.
- ArcMap Tutorial: USA Census Tutorial: Housing Demographic Data in Boston
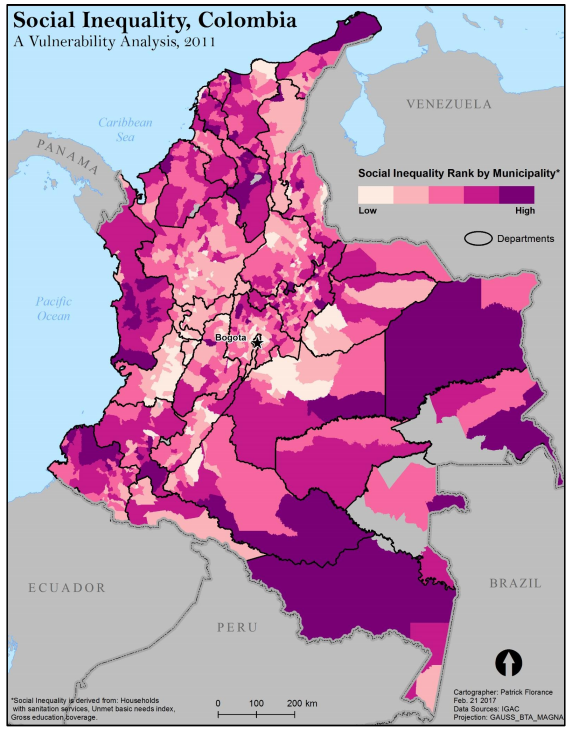
Using Census Data to Calculate a Social Inequality Index in Colombia
This tutorial uses international census data from Colombia to review Joins and Selection tools. The tutorial aims to teach students how to create a vulnerability model within the Attribute Table by Adding Fields and using Field Calculator. Students will create a final map layout showing social inequality and vulnerability.
- ArcGIS Pro Tutorial (Version 3.1.4): Using Census Data to Calculate a Social Inequality Index in Colombia
- ArcMap Tutorial (Version 10.8.2): Using Census Data to Calculate Social Inequality in Colombia
- Data Available Here
Working with Census 2000 Data from MassGIS
In this tutorial, you will use pre-processed census data from Massachusetts to create maps of demographic and housing variables at the Block Group level. Important: This tutorial uses Census 2000 data, not 2010!
- ArcMap Tutorial: Working with Census 2000 Data from MassGIS

Using Census Geolytics – Neighborhood Change Database
Census Geolytics Neighborhood Change Database is an archive of census data at the census tract level for 1970, 1980, 1990, and 2000. Tufts Data Lab has purchased this and other Census Geolytics products.
- ArcMap Tutorial: Using Census Geolytics – Neighborhood Change Database
Quick Census Tip Sheets:
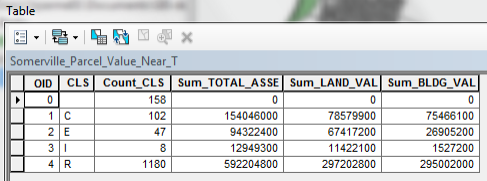
- ArcMap Tip Sheet: Viewing Statistics & Summarizing Information
- ArcMap Tip Sheet: Clipping Census Shapefiles
- ArcMap Tip Sheet: Estimating and Mapping Reliability for American Community Survey Data
Geocoding and Adding Latitude & Longitude (XY) Data
Geocoding vs. Add XY Data (Latitude & Longitude) using Data Axle Reference Solutions
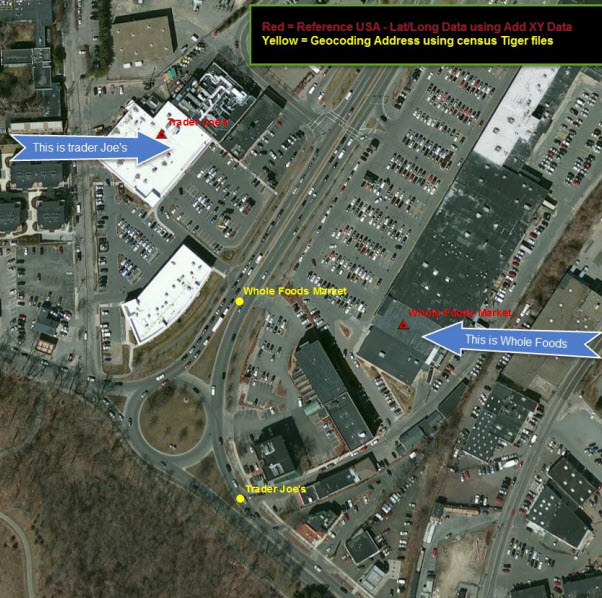
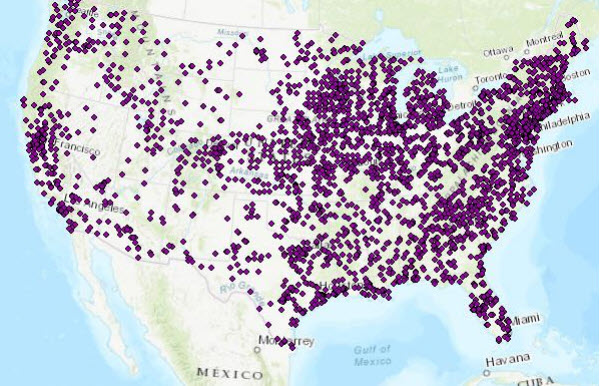
In this exercise, you will learn how to download business data from Axle Reference Solutions (previously Reference USA). You will then map it in ArcGIS. The exercise demonstrates three methods for geolocating business (or other address-based) information to compare accuracy. It will cover using latitude and longitude (Add XY data) coordinates, geocoding using address information from Census TIGER street centerlines, and geocoding to address points for the city of Cambridge.
- ArcGIS Pro Tutorial (Version 3.1.4): Geocoding vs. Add XY Data using Data Axle Reference Solutions data
- ArcMap Tutorial: Geocoding vs. Add XY Data using Reference USA data in ArcMap – Using Tiger 2019 Shapefiles
Displaying Latitude & Longitude Coordinates in ArcGIS
In this tutorial, users will learn how to import a table of longitude and latitude coordinates (or XY data) in decimal degrees as points in GIS.
- ArcGIS Pro Tutorial (Version 2.3): Displaying Latitude & Longitude Data (XY Data)
- ArcMap Tutorial: Displaying Latitude and Longitude (XY) Data in ArcMap
- Data available here
Downloading Data with DNRGPS and Importing to ArcGIS and Google Earth
This tutorial explains how to download GPS waypoints from a GPS unit, view the points on Google Earth, and import the data to ArcMap.
GIS Data Sources & Data Management
Data Management Tip Sheets
- GIS Data Management & Organizational Tips in ArcMap
- Creating a File Geodatabase in ArcMap
- Copying Read Only GIS Data and Making it Writable in ArcMap
- Working with Excel spreadsheets in ArcMap
- Creating a Smaller Data Set From a Larger Data Set – Vector Data in ArcMap – This tutorial uses selection tools to create a selection from a larger dataset and exporting it as a new layer.
- Extracting and Clipping raster data in ArcMap – Creating a Smaller data Set From a Larger One – Raster Data
Working with Google Data Files in ArcGIS
Geocoding Addresses with Google Maps
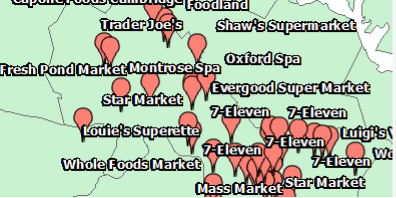
This tutorial uses data about Cambridge grocery stores from Reference USA to visualize Google Maps data and convert it to ArcMap shape files.
- ArcMap Tutorial: Geocoding Addresses with Google Maps
Converting Google Earth .kml Files to .shp Files (and vice versa)
This tutorial shows how to convert a feature or raster layer into a KML file format to display these geographic data in an Earth browser (e.g., Google Earth, Google Maps, ArcGIS Explorer, ArcGlobe). If you have built a map in Google Earth that you would like to import to ArcGIS, this tutorial will also lead you through converting Google Earth files to ArcGIS layers.
Open Street Map (OSM) Data

Downloading & Accessing OpenStreetMap (OSM) Data in ArcGIS
OpenStreetMap enables users to access free geographic data and mapping tools. This tutorial reviews understanding the type of data that OpenStreetMap provides, learning key concepts when looking for data on online repositories (availability, data format, etc.), and using online extraction tools to export OpenStreetMap data into ArcMap.
- ArcGIS Pro Tutorial: Downloading & Using OpenStreetMap (OSM) in ArcGIS
- ArcMap Tutorial: Downloading & Accessing OpenStreetMap (OSM) Data in ArcMap

How to Access and Display Data from OpenStreetMap
This tip sheet uses a Kolkata, India section as a sample location for accessing, downloading, and displaying OpenStreetMap data.
- ArcMap Tutorial: How to Access and Display Data from OpenStreetMap
NRCS Soils Database

Working with the National Resources Conservation Service (NRCS) Soils Database
County-level soils data (SSURGO) can be obtained from the National Resources Conservation Service (NRCS). This tutorial covers accessing NSRC data, joining tables to maps, and layer properties like symbology.
- ArcMap Tutorial: Working with the NRCS soils database
Digital Elevation Models (DEM) Data

Working with Digital Elevation Models (DEM) Data in ArcGIS
This tip sheet covers basic information about working with elevation data, including how to prepare the data and understand general processing. It also walks through creating a 3-D TIN elevation model from a contour line file.
- ArcMap Tutorial: Working with elevation data in ArcGIS

Converting GIS Contour Data to CAD Data
This tutorial reviews the GIS to CAD conversion of contour data for use in 3D modeling.
- ArcMap Tutorial: Converting GIS contour data to CAD
Georeferencing & Editing Tools

Georeferencing a Scanned Map
This tutorial reviews how to align a non-georeferenced image (e.g., scanned maps) to an existing geographic layer or georeferenced image as visual displays in your map.
- ArcMap Tutorial: Georeferencing a scanned map (map image) in ArcMap

Ghana Exercise – Georeferencing a Scanned Map and Digitizing using Editor Tools
This tutorial reviews georeferencing and digitizing using road data from Ghana.
- ArcMap Tutorial: Georeferencing & Digitizing – Ghana Exercise
Editing Toolbar Tip Sheets
Map Projections & Coordinate Systems
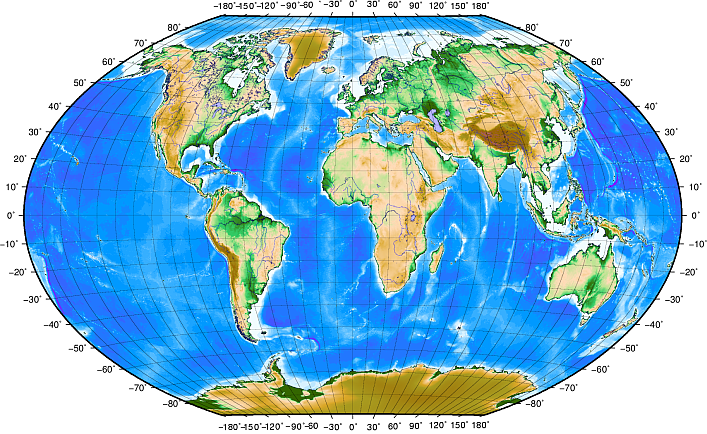
Troubleshooting Coordinate Systems
This tutorial walks you though understanding your data layers and data frames spatial reference and selecting an appropriate projection for your data. It also identifies how to use the Define Projection tool if you have missing or incorrect spatial references and it explains how to use the Project tool to project your data into a different projection.
- ArcGIS Pro Tutorial: Trouble-Shooting Coordinate System (and Projection) Problems
- ArcMap Tutorial: Troubleshooting Coordinate Systems
- Data available here
Projection Tip Sheets
- How to define a map projection in ArcMap
Proximity & Network Tools and Analyses
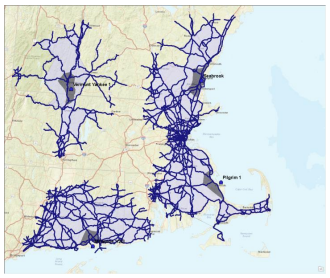
Proximity Tutorial: A Risk Assessment for Nuclear Power Plants in Southern New England
This exercise walks through a simple analysis of the population at risk around New England’s four nuclear power plants and exploring potential evacuation centers and routes. You can follow along and practice using the following tools: Spatial join, buffer and multi-ring buffer, near tool, point distance tool, and network analysis – service area.
- ArcGIS Pro Tutorial:
- ArcMap Tutorial: Proximity Tutorial: A Risk Assessment for Nuclear Power Plants in Southern New England
- Download Tutorial Data

Network Analyst Workflow for Creating a Service Area / Travelshed
This tutorial reviews the workflow of different types of network-based analyses, including service area analysis, vehicle routing, location allocation, and more.
- ArcMap Tutorial: Network Analyst Workflow for Creating a Service Area / Travelshed
Vector Geoprocessing Tools & Analyses
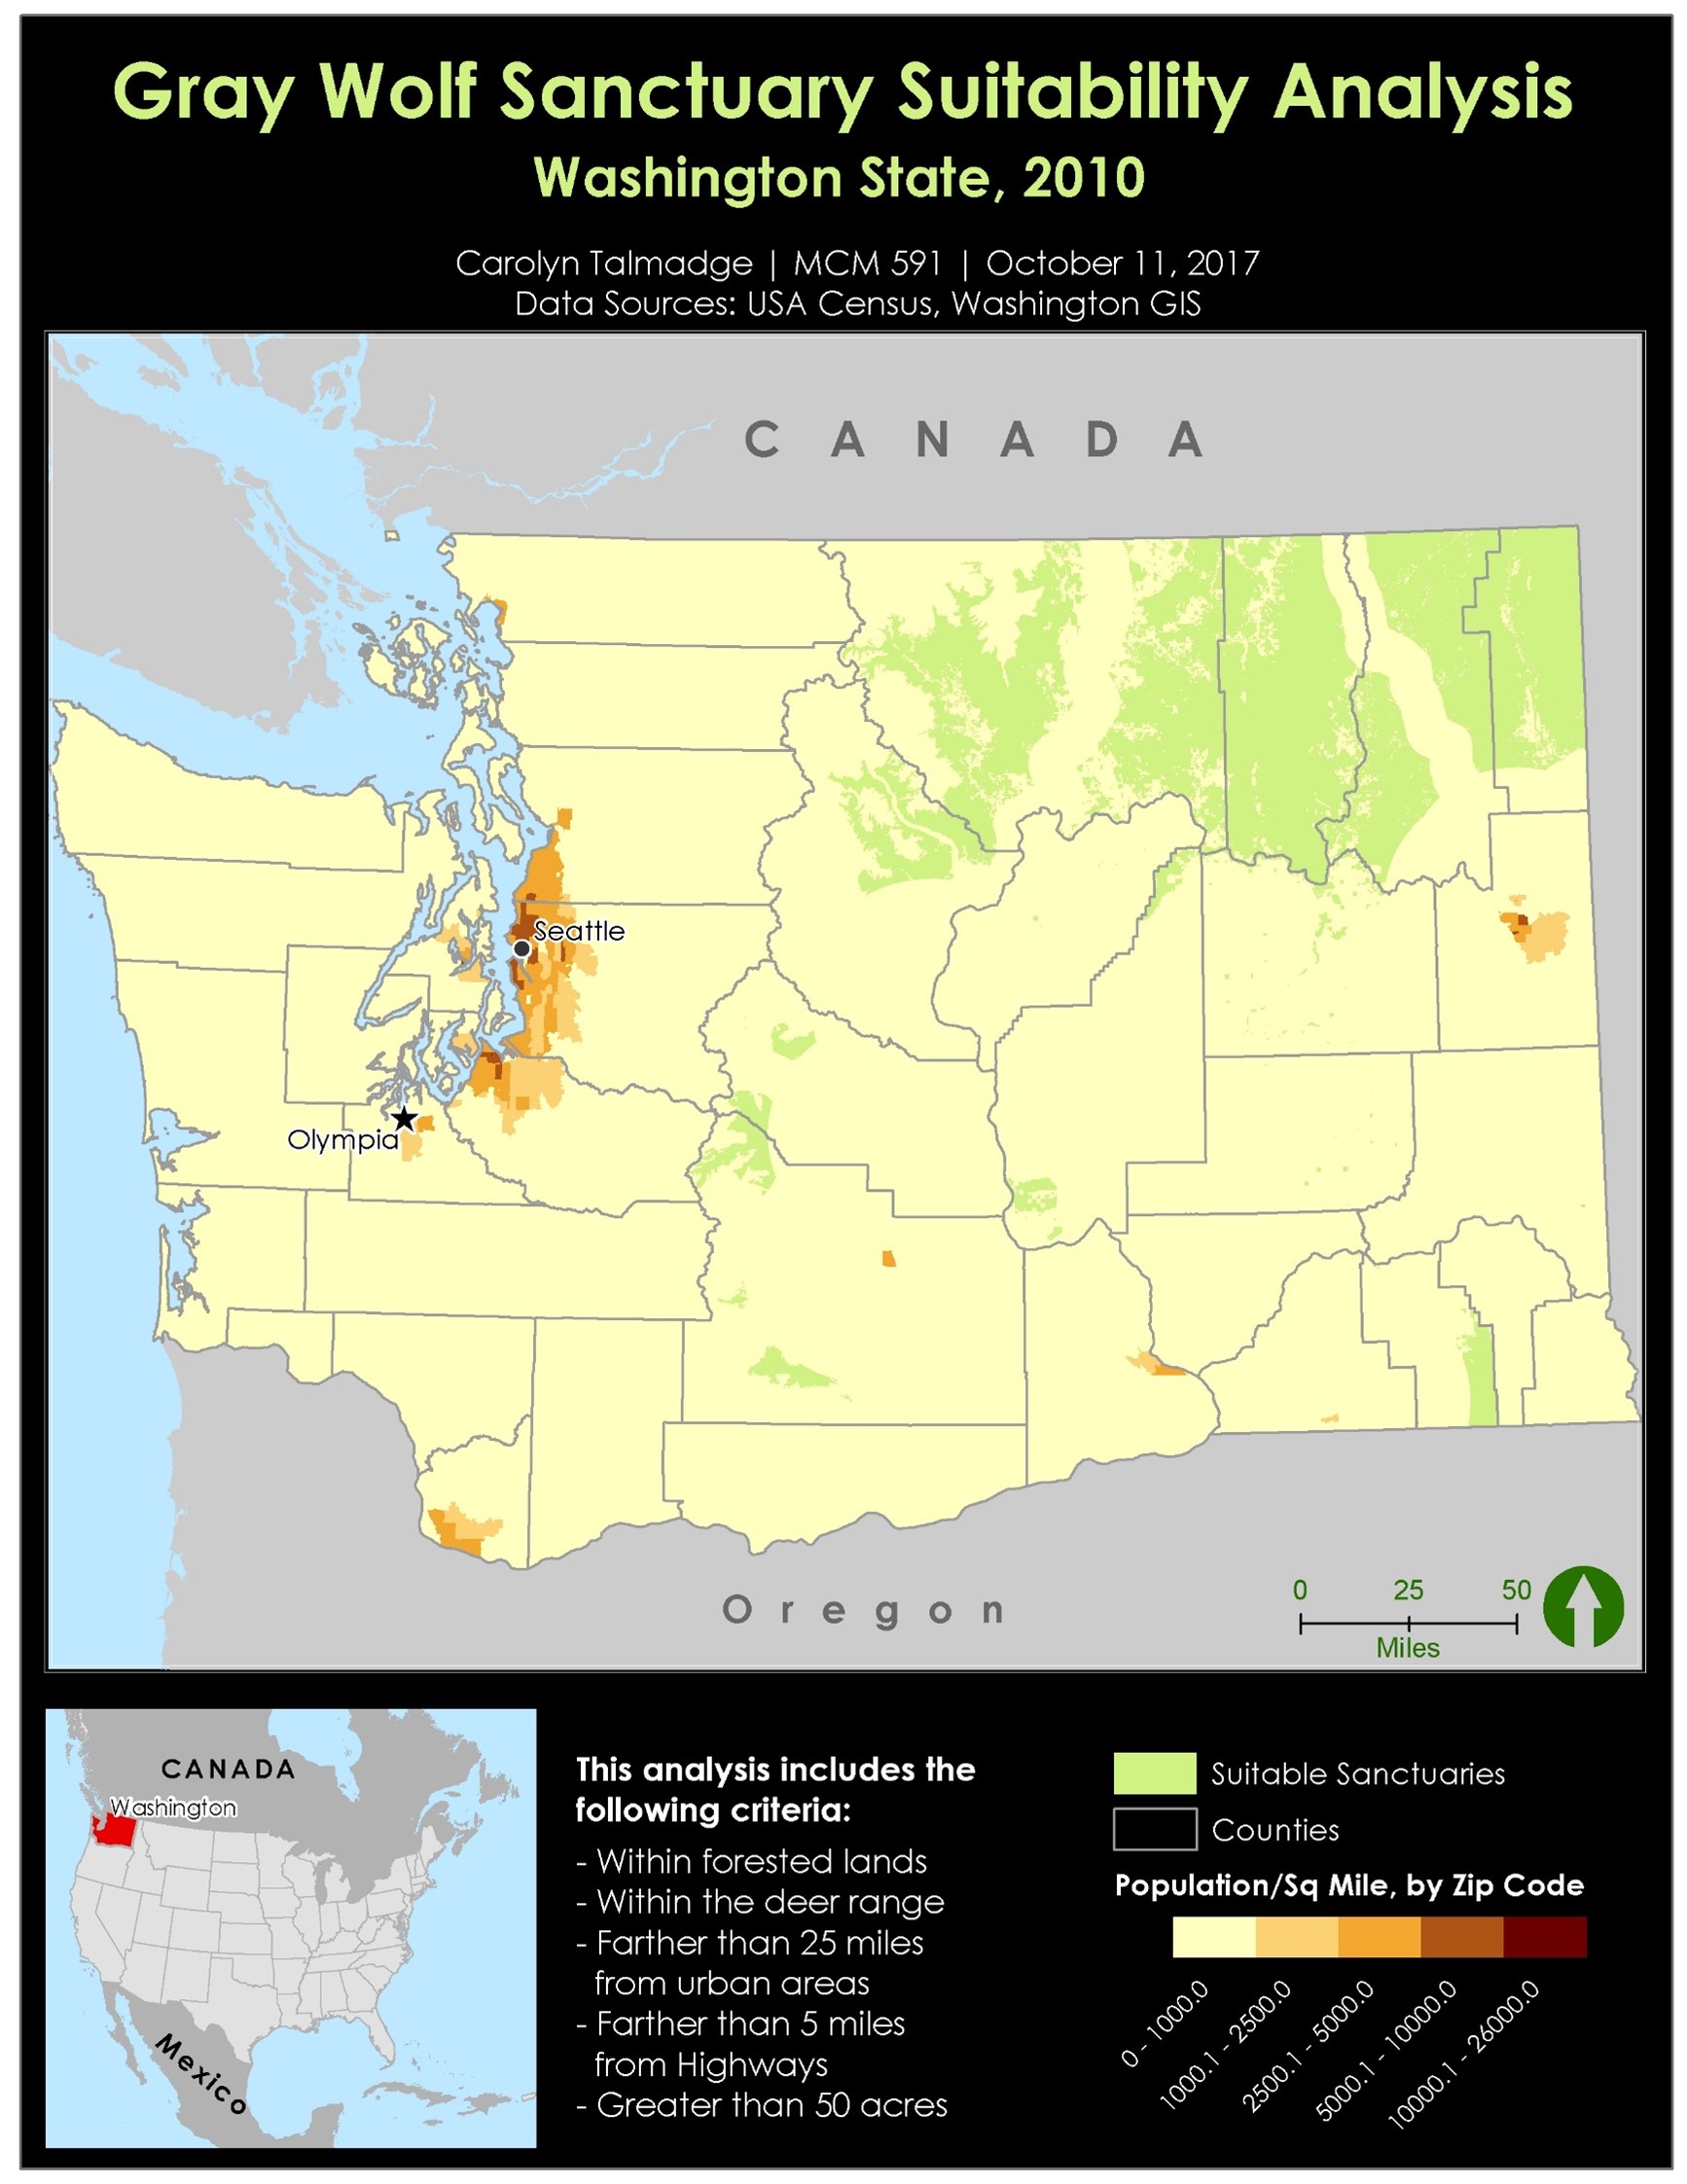
Vector Suitability Tutorial- Finding Suitable Sanctuary Locations for the Gray Wolf in Washington State
The purpose of this tutorial is to learn how to use Geoprocessing Tools on VECTOR Datasets (points, lines and polygons) to determine suitable potential locations for a Gray Wolf Sanctuary in the State of Washington.
Tools used during this tutorial include: Buffer; Intersect; Erase; Dissolve; Select by Attributes; Add Field/Calculate Geometry
- ArcGIS Pro Tutorial (Version 3.1.4): Vector Overlay Analysis: Finding Suitable Locations for a Gray Wolf Sanctuary
- Data can be accessed here
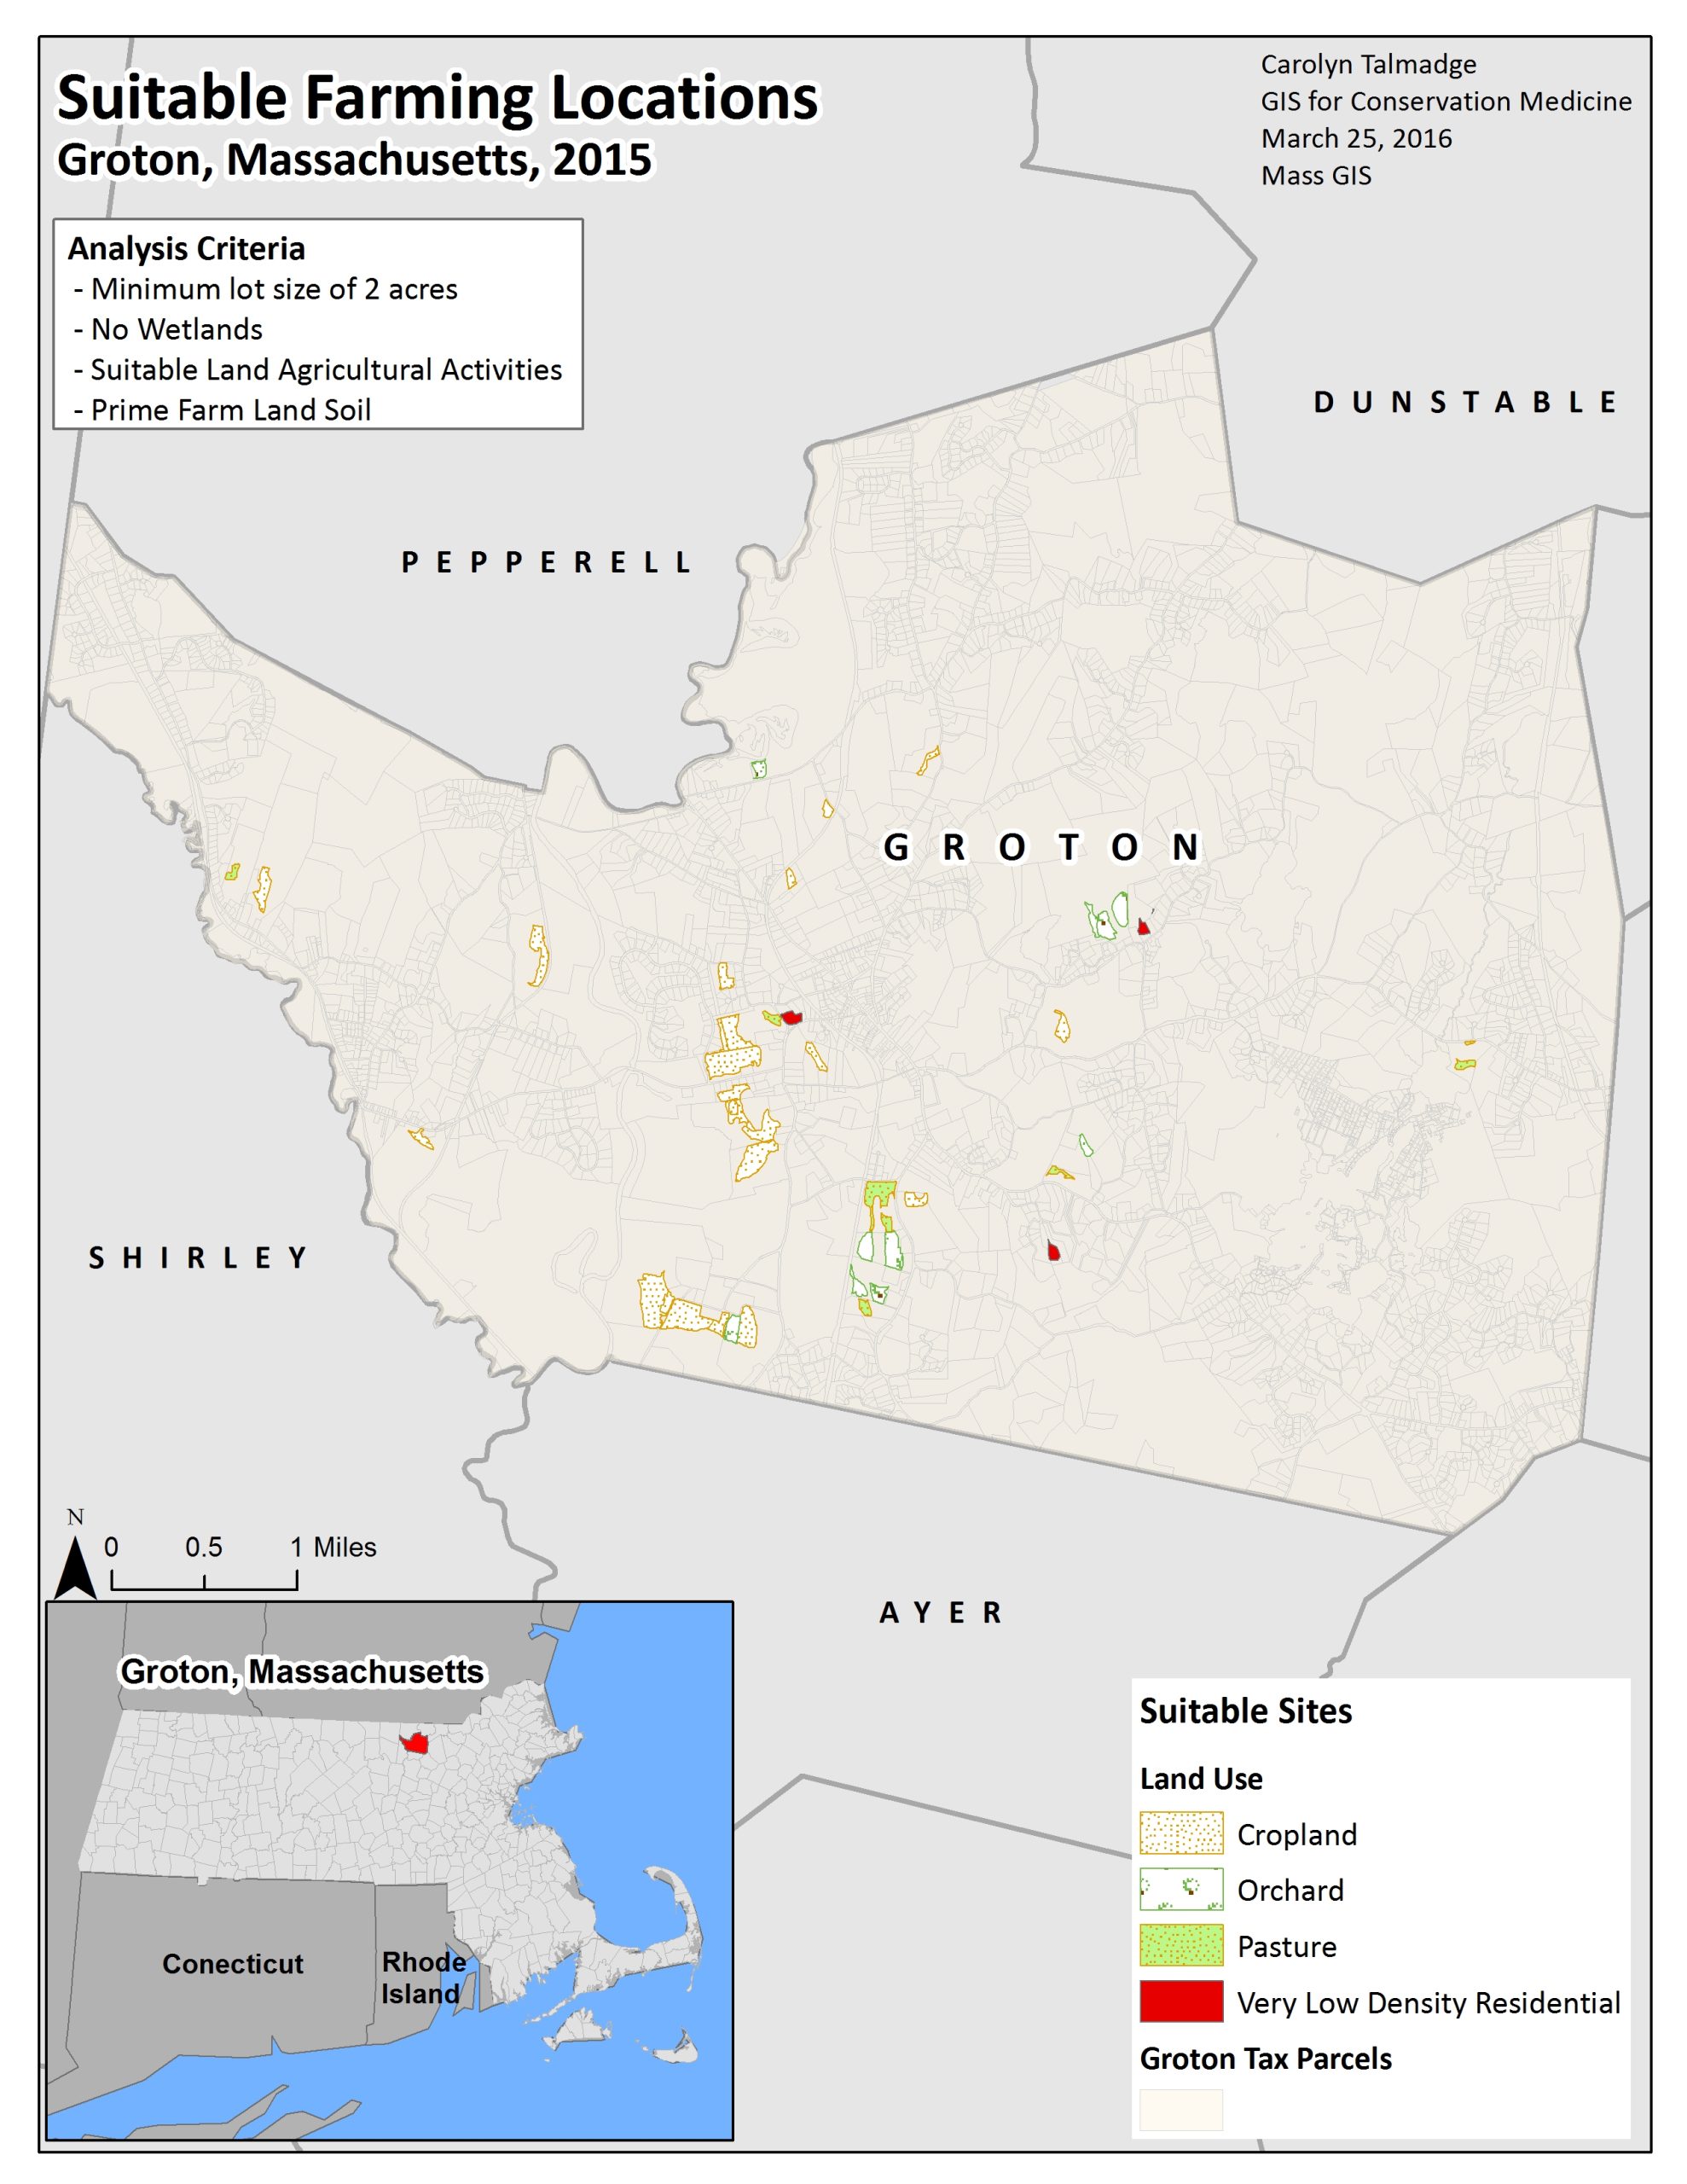
Vector Suitability Tutorial- Farm Land Suitability Analysis in Groton, Ma
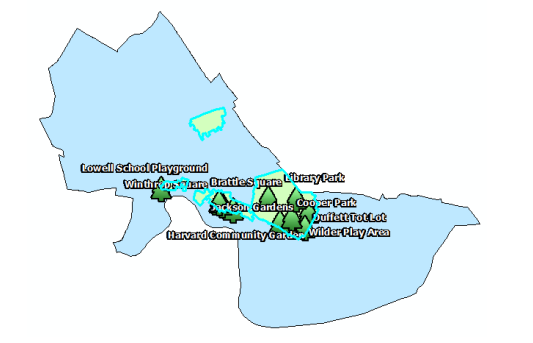
In this tutorial, you will identify potentially suitable parcels for urban farming for the New Entry Sustainable Farming Project (“New Entry”), which assists people with limited resources who have an interest in small-scale commercial agriculture to begin farming in Massachusetts (http://www.nesfp.org/). Much of the prime farmland in Middlesex County (where the town of Groton is located) has been developed, mostly for residential use. However, a growing population of beginning farmers has created a demand for agricultural uses on some of this land. You will learn how to employ basic vector geoprocessing analysis tools (Select by Attribute queries, joining a table to a shapefile, performing an Intersect) to identify potentially suitable farming parcels in Groton, MA.
- ArcGIS Pro Tutorial (Version 3.1.4): Farm Land Suitability Analysis for Vector Data in Groton, MA
- ArcMap Tutorial: Vector Suitability Tutorial – Farm Land Suitability Analysis in Groton, Ma
- Data can be accessed here

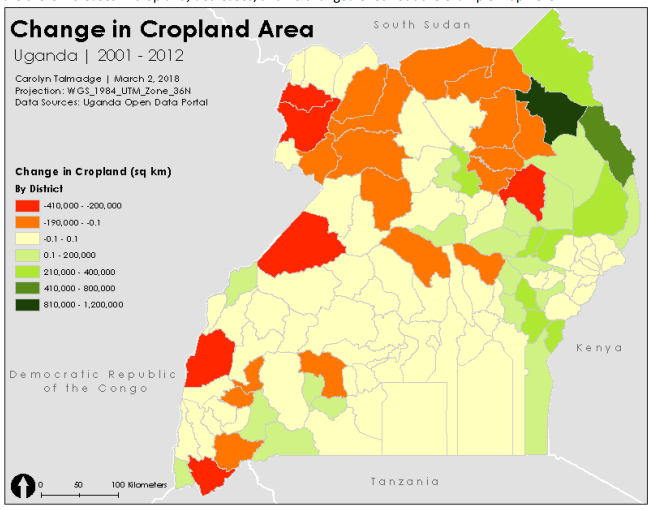
Calculating Conflict Density and Change over Time in Uganda using Vector Techniques
This tutorial uses the Armed Conflict Location and Event Dataset (ACLED) data to create density maps of conflict events in Uganda for 2000 to 2004 and 2005 to 2010 using vector processing techniques. Students then calculate the change in conflict and create a final map to display where Uganda has experienced an increase and decrease in conflict over this time period. This tutorial provides vector methods to calculate the density of incidents rather than using the hotspots function in the Hot Spot / Kernel Density Analysis: Calculating the Change in Uganda Conflict Zones tutorial.
By the end of this tutorial, students will be familiar with the following tools: Joining tabular data; Calculate area; Spatial join; Field calculator
Spatial Analyst Tools & Advanced Raster Analyses
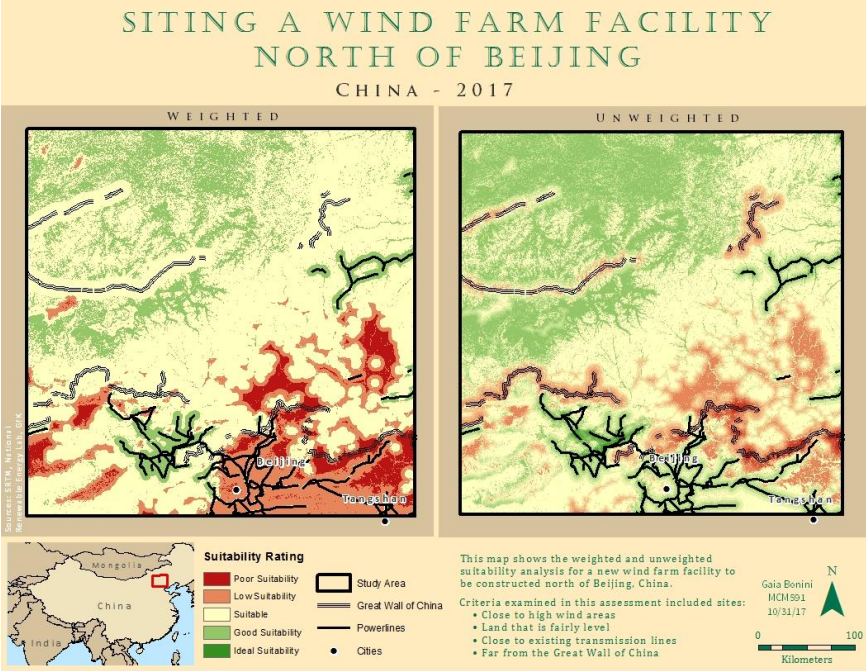
Raster Suitability Analysis: Siting a Wind Farm Facility North of Beijing, China
The purpose of this suitability analysis is to find optimal locations for an energy storage facility that will serve Wind Farms in the region north of Beijing.
- ArcGIS Pro Tutorial (Version 3.1.4): Raster Suitability Analysis: Siting a Wind Farm Facility North Of Beijing, China
- ArcMap Tutorial: Raster Suitability Analysis: Siting a Wind Farm Facility North of Beijing, China
- Download Tutorial Data
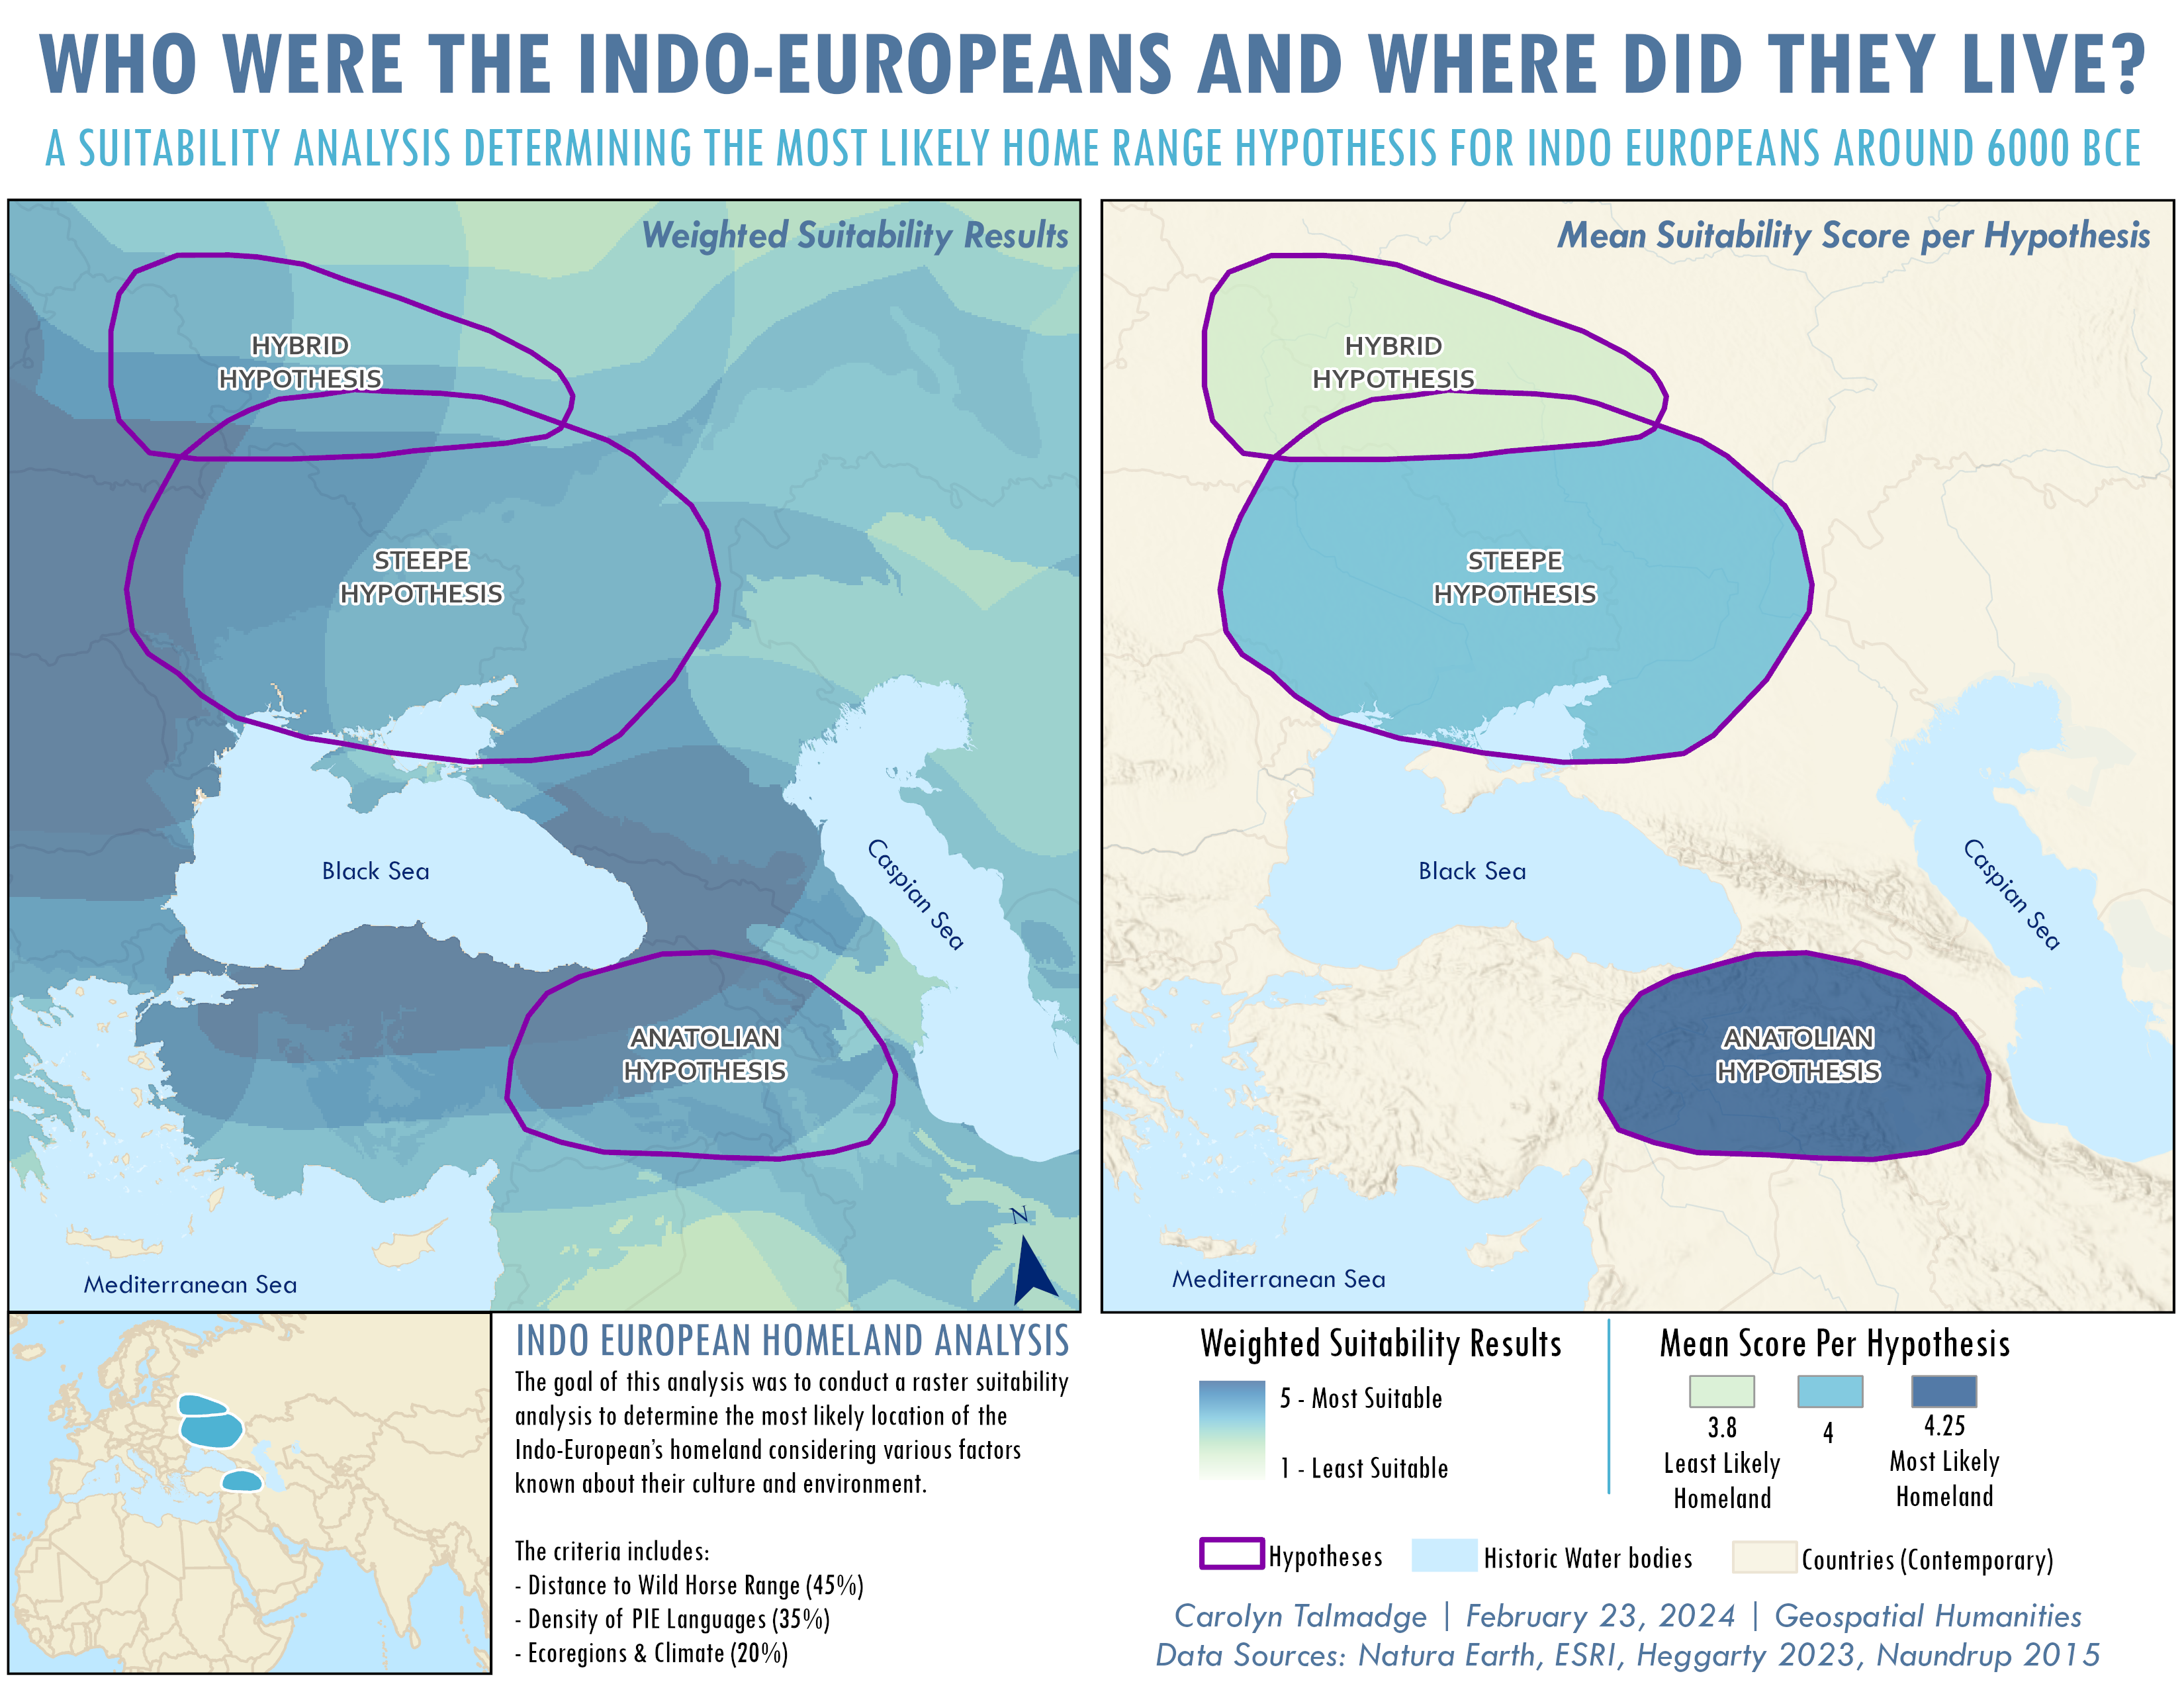
ArcGIS Pro Raster Suitability Analysis: Who were the Indo-Europeans and where did they live?
The goal of this tutorial is to learn how to conduct a raster suitability analysis to determine the most likely location of the Indo-European’s homeland considering various factors experts know about their culture and environment, including the density of Proto-Indo-European languages, distance to wild horse range in 5000BCE, and historical climate data. You will use the analysis criteria to determine which of the three proposed homeland hypotheses by Heggarty et al. is the most to least likely for their homeland.
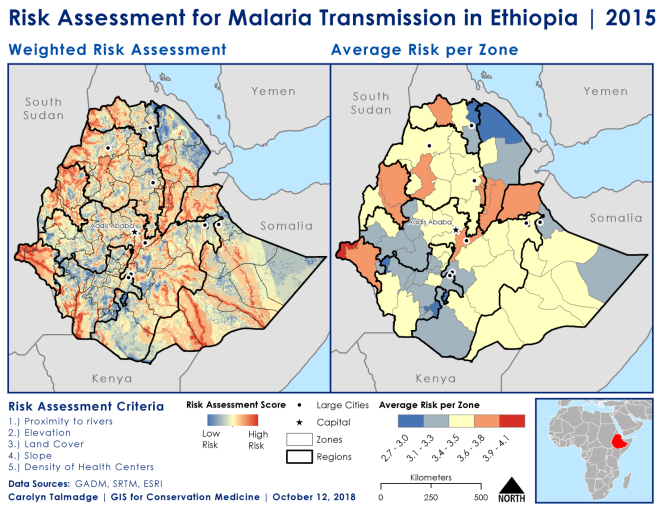
Raster Risk Assessment: Determining the Risk of Malaria Transmission in Ethiopia
The purpose of this analysis is to determine the overall risk of Malaria transmission throughout Ethiopia when considering proximity to rivers, elevation, slope, land cover, and accessibility of health clinics.
- ArcGIS Pro PowerPoint Guide: Raster Risk Assessment of Malaria in Ethiopia
- ArcMap Tutorial: Raster Risk Assessment: Determining the Risk of Malaria Transmission in Ethiopia
- Download Tutorial Data
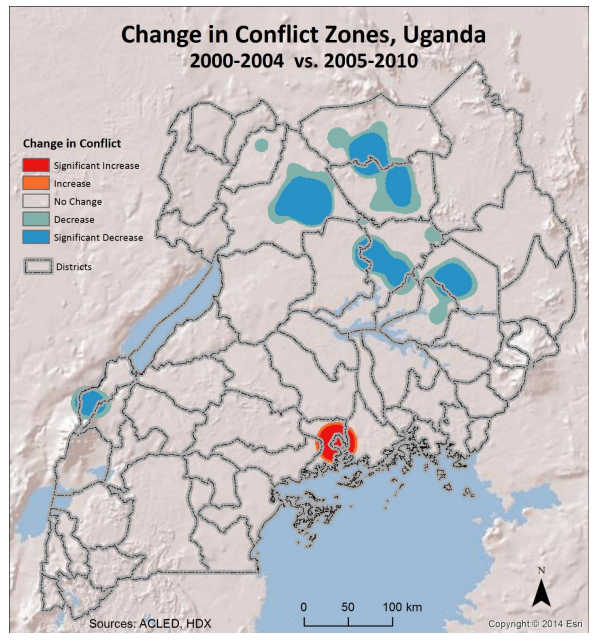
Hot Spot and Kernel Density Analysis: Calculating the Change in Uganda Conflict Zones
This tutorial uses Armed Conflict Location and Event Dataset (ACLED) data to create hot spot maps of conflict events in Uganda for two time periods: 2000-2004 and 2005-2010. The final map displays where Uganda has experienced an increase and decrease in conflict over this time period. By the end of this tutorial, students will be familiar with the following tools: Kernel Density Tool, Raster Calculator, and Setting your Geoprocessing Environments.
Overlay Analysis: Using Zonal and Extract Tools to Transfer Raster Values
If you have raster data that you want to join to existing vector data, you can transfer these data values in ArcMap using the Spatial Analyst toolbar. Skills covered in this tutorial include enabling the Spatial Analyst extension, using the Zonal Statistics Tool to tabulate areas, using the Extraction Tool to transfer underlying raster data to points, and calculating a percent change using the Field Calculator.
Spatial Statistics Tools & Analyses

Moran’s I and Spatial Regression: Homeownership in Manhattan, NYC
This tutorial uses data on home ownership in the New York City borough of Manhattan to demonstrate two powerful spatial statistical tests: Moran’s I (a test for spatial autocorrelation to examine whether a phenomenon is clustered or not) and Spatial Regression (the ability to predict a value of an outcome variable based on values of explanatory variables when spatial dependency is accounted for in the model). It covers how to check the basic assumptions about the data, how to create spatial weights, how to report and interpret your cluster analysis, and more.
This tutorial takes approximately 1 1/2 hours to complete.
- ArcMap Tutorial: Moran’s I and Spatial Regression
Additional Raster Tip Sheets
Water Resources Tutorials
Introduction to ArcGIS for Water Resources Data
This tutorial serves an introduction to ArcMap and explains how to acquire and map water resource data like National Land Cover Data (NLCD) and National Hydrography Data (NHD) from the U.S. Geological Survey (USGS).
- ArcMap Tutorial: Introduction to ArcMap for Water Resources Data

Delineating Watershed from a Digital Elevation Model
This tutorial walks through the steps of creating watersheds as rasters and polygons, setting flow direction for the elevation raster, and locating and filling sinks (i.e., a group of one or more cells that have lower elevations than all the surrounding cells).
- ArcMap Tutorial: Delineating Watersheds from a Digital Elevation Model (DEM)

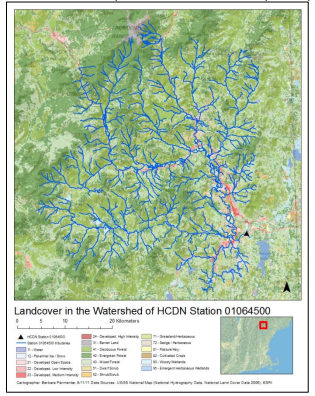
Watershed and Drainage Delineation by Pour Point
In this tutorial, you will learn how to delineate the boundary of a stream gage’s drainage area
(watershed polygon) based on a Digital Elevation Model (DEM) and how to delineate the
drainage network (lines) within the watershed.
- ArcMap Tutorial: Watershed and Drainage Delineation by Pour Point
Cartography & Poster Design

GIS Poster Design Tips & Tricks
This PowerPoint reviews several design concepts from layout, color, fonts, alignment, visual hierarchy, and cartography tips. It shows several tricks using Publisher for creating excellent GIS Posters.
PowerPoint: GIS Poster Design Tips & Tricks

GIS Project Analysis Tips & Best Practices
This PowerPoint has several GIS project and analysis best practices and tips. From where to save/store your data (H drive vs Box), to best practices for exporting maps for a poster, to analysis tips and tricks for troubleshooting and designing beautiful posters. It’s a great guide for making sure you’re taking the easiest route possible when it comes to GIS projects!
PowerPoint: GIS Project Tips & Tricks

Designing and Creating your Poster – Publisher set-up and PDF directions
Step by step guide on how to use Microsoft Publisher for creating a poster.
- Publisher Tutorial: Creating & Designing a GIS Poster in Microsoft Publisher
- Publisher Exercise Files (.zip) – The instructions reference these exercise files; however, you can use the tutorial without the exercise files.
Cartography Tip Sheets
- Cartography Tips in ArcMap
- Using the ArcMap Data Frame Clip Option to Mask Features
- Creating and Editing Scale Bars and Legends in ArcMap
ArcGIS Online (AGOL) Tutorials
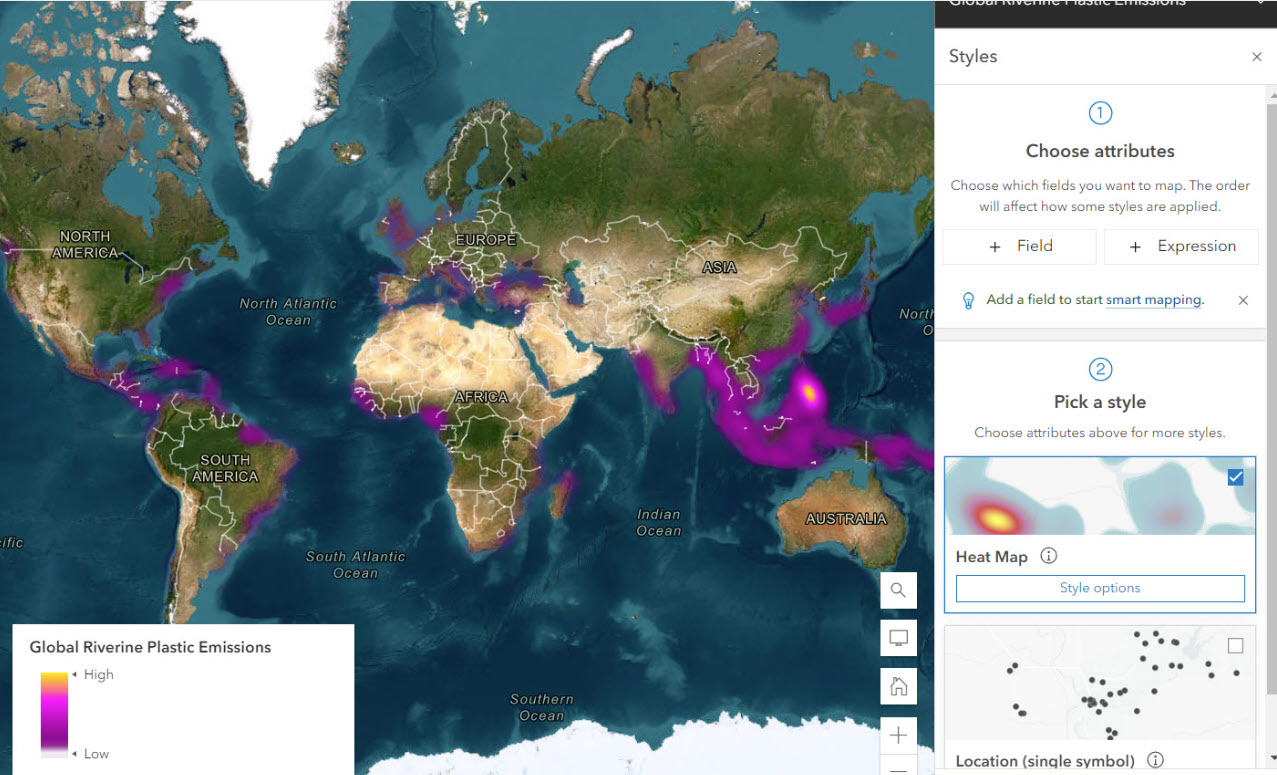
Plastic Pollution in the Ocean: Using ESRI ArcGIS Online (AGOL) Map Viewer
This tutorial goes through an introduction to GIS, spatial data, and spatial formats. Then it goes through an activity creating a web map of plastic pollution in our oceans. It covers adding data, stylizing data, configuring pop ups and sharing a web map.
ArcGIS Online New Map Viewer Link
ArcGIS Online Class Map Viewer Link
Additional Resources
- Esri Support Center: For the experienced ArcGIS user, this is THE place to find answers. When you type in a question or search terms, the site searches ESRI user forums, Help pages, technical papers, and user-written scripts for ArcGIS. To track responses, create a free Esri Global Account!
- ArcGIS Help for versions 10.2, 10.2.1, and 10.2.2: The online Help for ArcGIS hosted by Esri. Please note this is an archive; Documentation and other information about the most recent releases of ArcGIS for Desktop and ArcGIS for Server are now hosted on http://desktop.arcgis.com/en/ and http://server.arcgis.com/en/ respectively.
- International Institute for Geo-Information Science and Earth Observation in the Netherlands: A very thorough introduction to the geometric aspects of map projections and datums from the International Institute for Geo-Information Science and Earth Observation in the Netherlands