Currently viewing the tag: "affiliation"
We at the library are gearing up for Affiliation week! (Well, more like Affiliation month…)
Twice every year, we walk around with a clipboard and find out how many students from each school is using the library. We do a survey for each day of the week, four times a day.
Maybe you’ve noticed people already walking around with clipboards, counting. That is for our statistics on the popularity of different spaces, like the study rooms or the couches. Affiliation week is different. During Affiliation, another library staff walks around and counts how many dental or TMC staff are using the library space. But we need your help. Our staff may have to ask you for you ID in order to count you and your study group. So, we wanted to give you some tips to get through this Affiliation season!
1. You can leave your ID on your desk beside you, so no one will interrupt you while you’re studying.
2. You can write down your affiliation on a piece of paper beside you.
3. We are leaving sheets in front of study room doors, intended to be filled out for each survey time (11 am, 3 pm, 6 pm, 9 pm)
4. Just tell whoever walks by.
We really appreciate your cooperation. This helps us put together our budgets for different resources. And, if you have any questions, you can always come down to the desk.
Hello everyone, and welcome back to Hirsh Library! It’s been good seeing those of you who have been around, and I hope the rest of you can make it sometime soon. Because fun fact: we’re open our full hours! You may have heard. I know some of you have heard, because just this past October we went around asking where you were from, and now we’ve got the data to prove it!
All the graphs you see below are from the library staff walking around for one week in October, asking the question “What program/school are you with?” You can click on them to make them larger if need be. If you’re interested in comparing this set of numbers to the way things looked pre-pandemic, then I would recommend checking out the post I wrote about the October 2019 Affiliation survey (please note: we did things a little bit different this time around, so it’s not a perfect 1 to 1 comparison, but it’s solid data all the same).
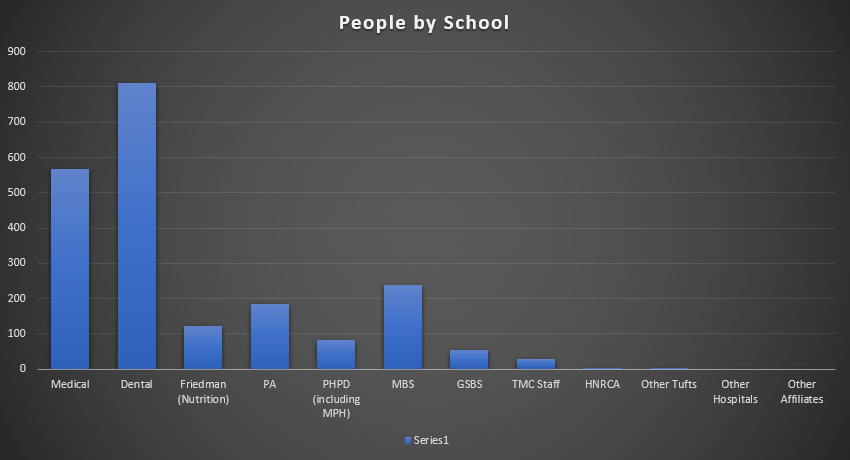
I’ll start with the information everyone always asks about first: how did the programs compare, numerically? Well, over the week 810 people told us they were with the Dental school, and 568 told us they were with Med. For those who weren’t here before the pandemic landed, you’ll be interested to know two facts: 1) that the numbers are lower than they were in 2019, but that the percentages here hold steady, and 2) I was honestly surprised at how many people turned up on this survey. It’s so great to see so many people are coming into the library, even when their classes are hybrid or even primarily online. And look at the rest of this spread! Friedman, PA, PHPD, and GSBS are all turning up in good numbers, and MBS has a strong showing at 238.
Hilariously, if you compare this data to its equivalent from 2019, you’ll realize that Dental, Medical, and PA all have lower numbers than two years ago, but somehow the other programs all went up. MBS being at 238 actually places it in third place for total counted for both 2019 and 2021.
Just goes to show: we’ve got some good furniture and space here.
But how does the furniture and space effect the counts? Glad you asked!

Everyone loves the 7th floor. This has never been in question, but seeing it laid out like this really drives it home. Normally, when I see numbers like this, the 7th floor is about double the next closest floor, which fluctuates between the 5th and 6th floors. This time, the 5th floor had 426 people, and the 7th had 1021. Amazing. And heartening to see!
The remaining ways of looking at these numbers are to break it down by weekday, and by time of the day. Here are those two charts:

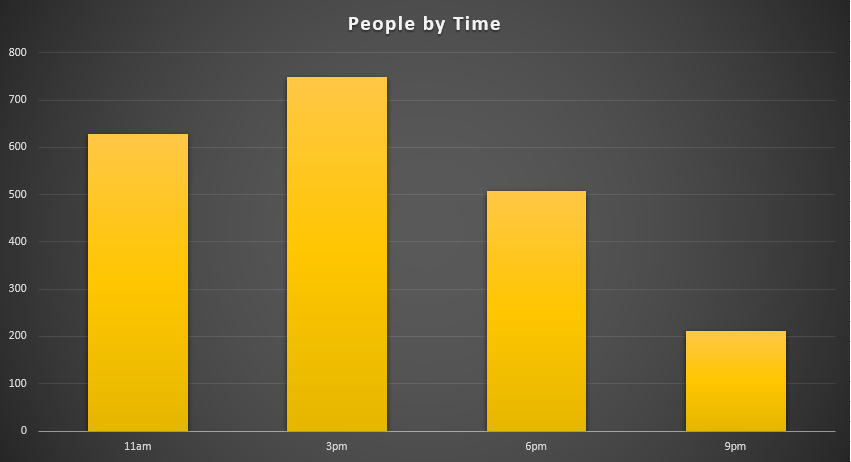
After the other two charts, these don’t provide anything too shocking. Thursday being the busiest day and 11am being the busiest time actually track with the way things were when we were closer to full capacity – the most popular weekday tended to fluctuate month-to-month between Tuesday, Wednesday, and Thursday, but the closer you are to lunch the busier the library gets.
Which is fair. Who doesn’t study with their stomach, after all?
I will leave you today with this thought: we have a staff full of people here to help, and we have a Reserves collection absolutely chock full of books, anatomy models, phone and laptop chargers, laptops, and about a dozen other things to help keep you supplied and comfortable while you’re studying and working on your papers, so that you can excel here at Tufts. In fact, we are stocked for numbers of visitors significantly higher than what you see in this post.
So why not stop on by to the Library Service Desk on the 4th floor of Med Ed, and see what we have to offer? We may surprise you.
In the meantime, have a great rest of your semester!
~Tom~
Hi there everybody!
Starting on Sunday, October 17th, we will be bringing back the School Affiliation Week. In past years we’ve scattered our days among an entire month, but given the way life is lately we decided it would be best to have it one-and-done, like a disposable face mask at the end of a long day. Here’s how it’s going to work.
From Sunday, October 17th through Saturday, October 23rd, members of the Hirsh Library staff will be walking around 3-4 times a day with a clipboard in hand. We’re going to ask everyone in the library what school/program they’re with (Med, Dental, GSBS, etc). And that’s it. We’ll make a check mark and move on. Afterward – probably sometime in late November (so I have time to analyze and collate), I’ll be posting the data we gather right here on this blog! If you want to see what that looks like, here’s my post from June 2020.
And this is what the survey looks like for us: 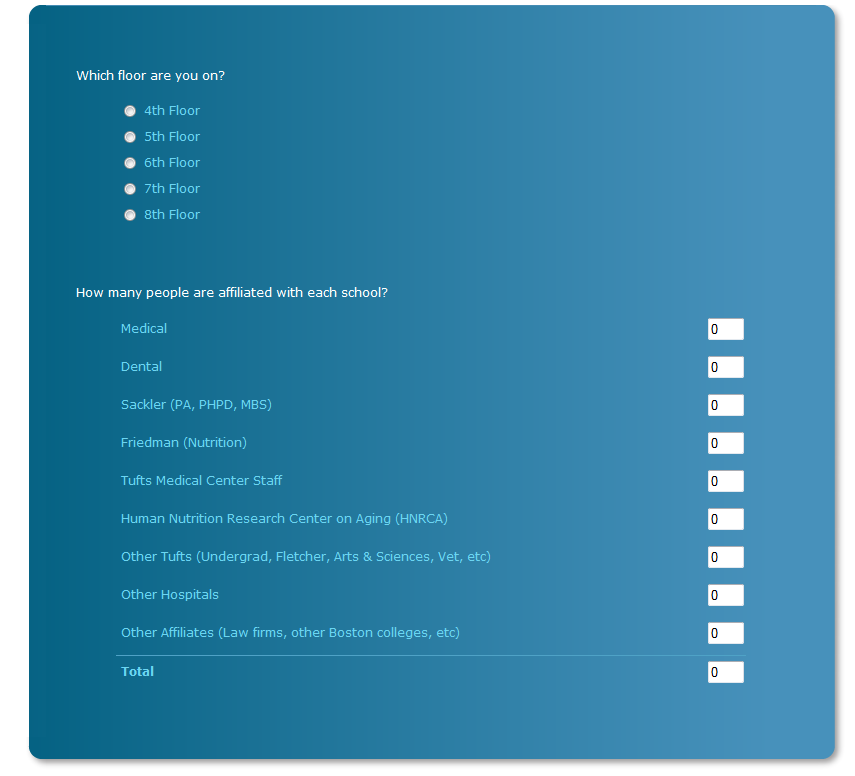
If you don’t want people to get too close, or you just don’t want your studying interrupted, you can always leave your ID out, or just write your program down on a piece of paper and leave it next to you. If you’re in a study room, feel free to write down the number of people and their program(s), and tape that to the outside of the study room door (not the window). If you need paper or tape we have them at the desk! Just come ask.
Just please remember to take down any signs you put up, and to remove any IDs or papers you put on the desks by you.
If you have any questions or concerns at all, don’t hesitate to ask us! You can call us at 617-636-6706, e-mail us at hhslcirc@tufts.edu, visit our live chat on the Ask Us page, or even just swing by the desk on the 4th floor and chat to us in person.
Thank you for your assistance with this, and we look forward to a nice smooth Affiliation Week!
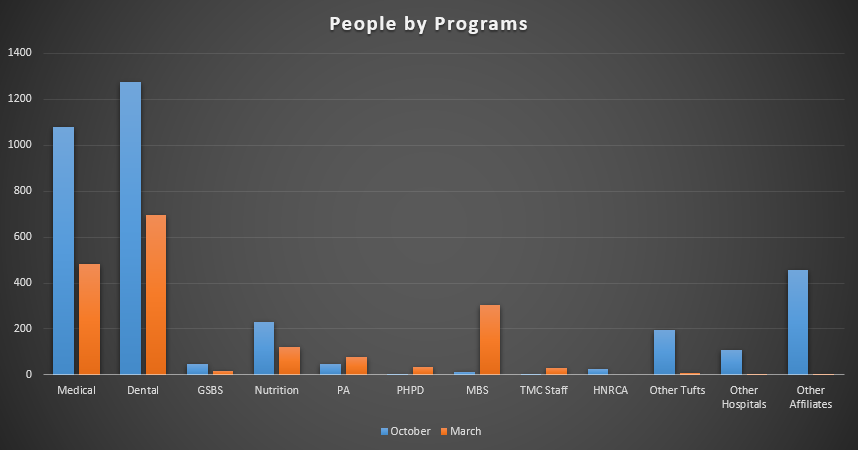
Back in October 2019 and March 2020, HHSL Staff walked around and counted how many people of each program were around the library. You may remember us, with the clipboards, asking that question.
Or…to be more accurate, we walked around throughout October, and half of March. We didn’t actually end up getting all of the dates we had wanted to in March (apparently there’s a global pandemic on), so we ended up with a truncated version of the survey for that month: 4 days of data instead of 7. Still, when it comes to trying to make a better Hirsh Library for everyone, even truncated data is better than none! So here’s some of what I can see.
Fair warning: I’m going to have to extrapolate and make a couple of assumptions here, since we’re missing so much of March’s potential data. I’ve seen enough data over the years to have a good sense of what it would be, but what should and what is are always different, so maybe get a salt grain ready to take with this post. Finally, the Y axis is always going to be Number of People Counted in this post, because I want this to be as easy to read as possible!
Click to enlarge.
Click to enlarge.
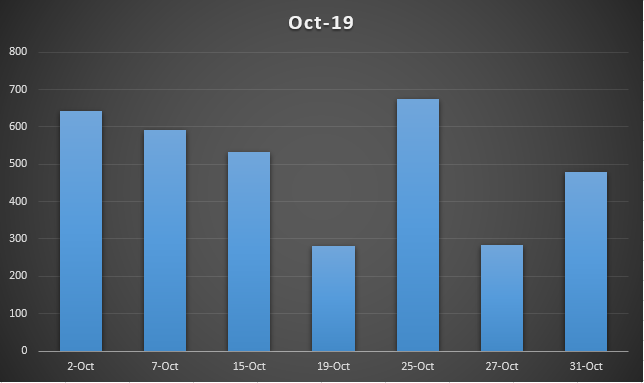
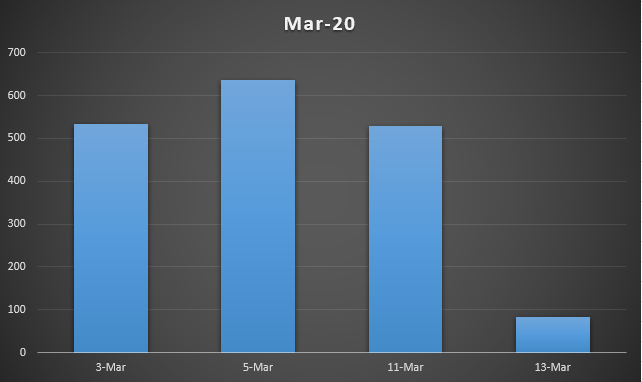
So, here’s the base data. October 2019 and March 2020. As you can see, we counted…actually not that many more people, all things considered. March 3rd, 5th, and even the 11th were all right in line with what we saw in October, in terms of library population. In fact the difference between the most populated day in October and the one in March is only 34 people. Which is great!
In case you’re wondering what happened on March 13th: that was the last Friday we were open normal hours. Staff, faculty, and students were already voluntarily staying home to work from there to keep themselves safe from the rapidly growing COVID-19 threat. On March 15th, the following Sunday, Tufts made the decision to close the campuses, and Monday the 16th was the last day the library was physically staffed in person (as a note, we are very much here for you online). So what you’re seeing in that data is the effect the virus was already having on the life of the library. March 11th: relatively normal day. March 13th: signs of a new normal.
But we’re not here for discussion of the virus, we are here for discussion of the data!
Click to enlarge.
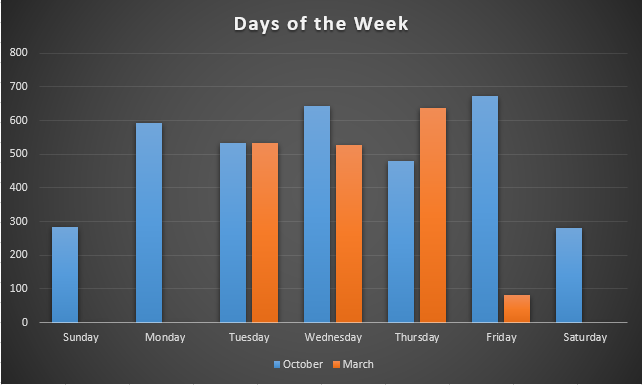
So, this is the same data as above, but oriented on what days of the week a given date was. Although the by-the-date data has its place, it’s good to know, say, what a week looks like. This is what a week and a half look like! And this is where that missing data makes me sad, because we’ll never know what the other days looked like in March. Traditionally, the weekends are the slowest days of the week, and the busiest tend to be Tuesday-Wednesday-Thursday. This is mostly matching, but…what was with that October Friday? My instinct is that it was an aberration, but without seeing in March it’s hard to tell how much of one it was. That a Friday was the busiest day we counted in October tells me that there must have been an event that day (a meeting? exams? a conference, perhaps?), but maybe it just chanced to be close to an exam.
In the end, one surprisingly busy day does not a library make. But it’s still fun to think about. Especially when you compare calendars to the data and realize that Friday, October 25th, happened to also be the second day of our pumpkin painting. Coincidence?

I think not.
Click to enlarge
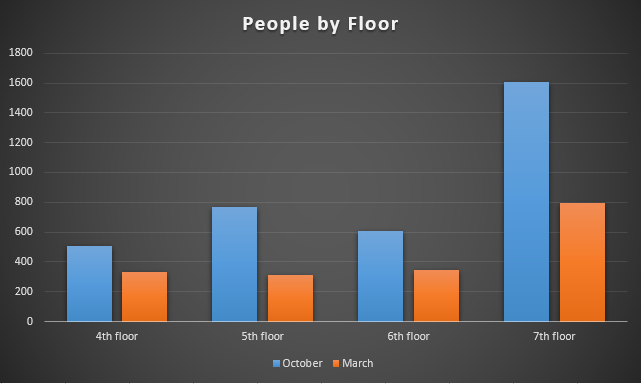
Okay, last two charts! The first is the People by Floor. So this ignores dates, and focuses on the aggregate. One thing I’ve been noticing in the last year or so is that the counts we get on the 7th floor are always roughly twice that of the next closest floor (which alternates). As you can see from October, that sometimes makes for some goofy looking charts. This is one of those rare cases where the missing data actually won’t make any real difference. Barring anomalies, what you see with that chart falls in line with years of existing data. That one is one I always predict with easy clarity. Which brings us to the final, and everyone’s favorite: programs!
Click to enlarge
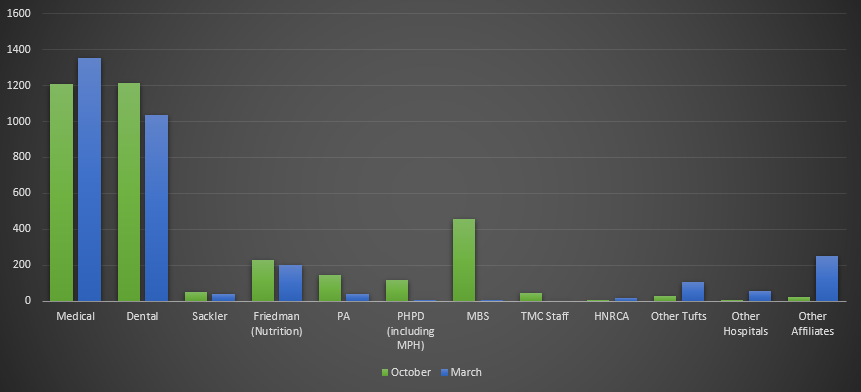
This is sort of wild to look at. So, okay, Dental and Medical are the programs dominating the numbers. That makes perfect sense, and honestly outside of minor variations, that’s what tends to happen. They were close in October, though, so I would have loved to see what those numbers looked like in March. Especially given the sudden notable presences of PA, PHPD, and MBS. Look at that MBS presence in March! That’s so great to see. I love it when I see sudden jumps in the number of people in the library. We’re here for everybody, after all!
That’s it for me today. Thank you for reading along, and I hope to see you all online this summer, where we are all seven days of the week. If you’re unsure the best way to reach out, well, try checking out our Ask Us page. Or hey, you can still Schedule a Consultation. There are lots of options.
And remember: wear your mask.
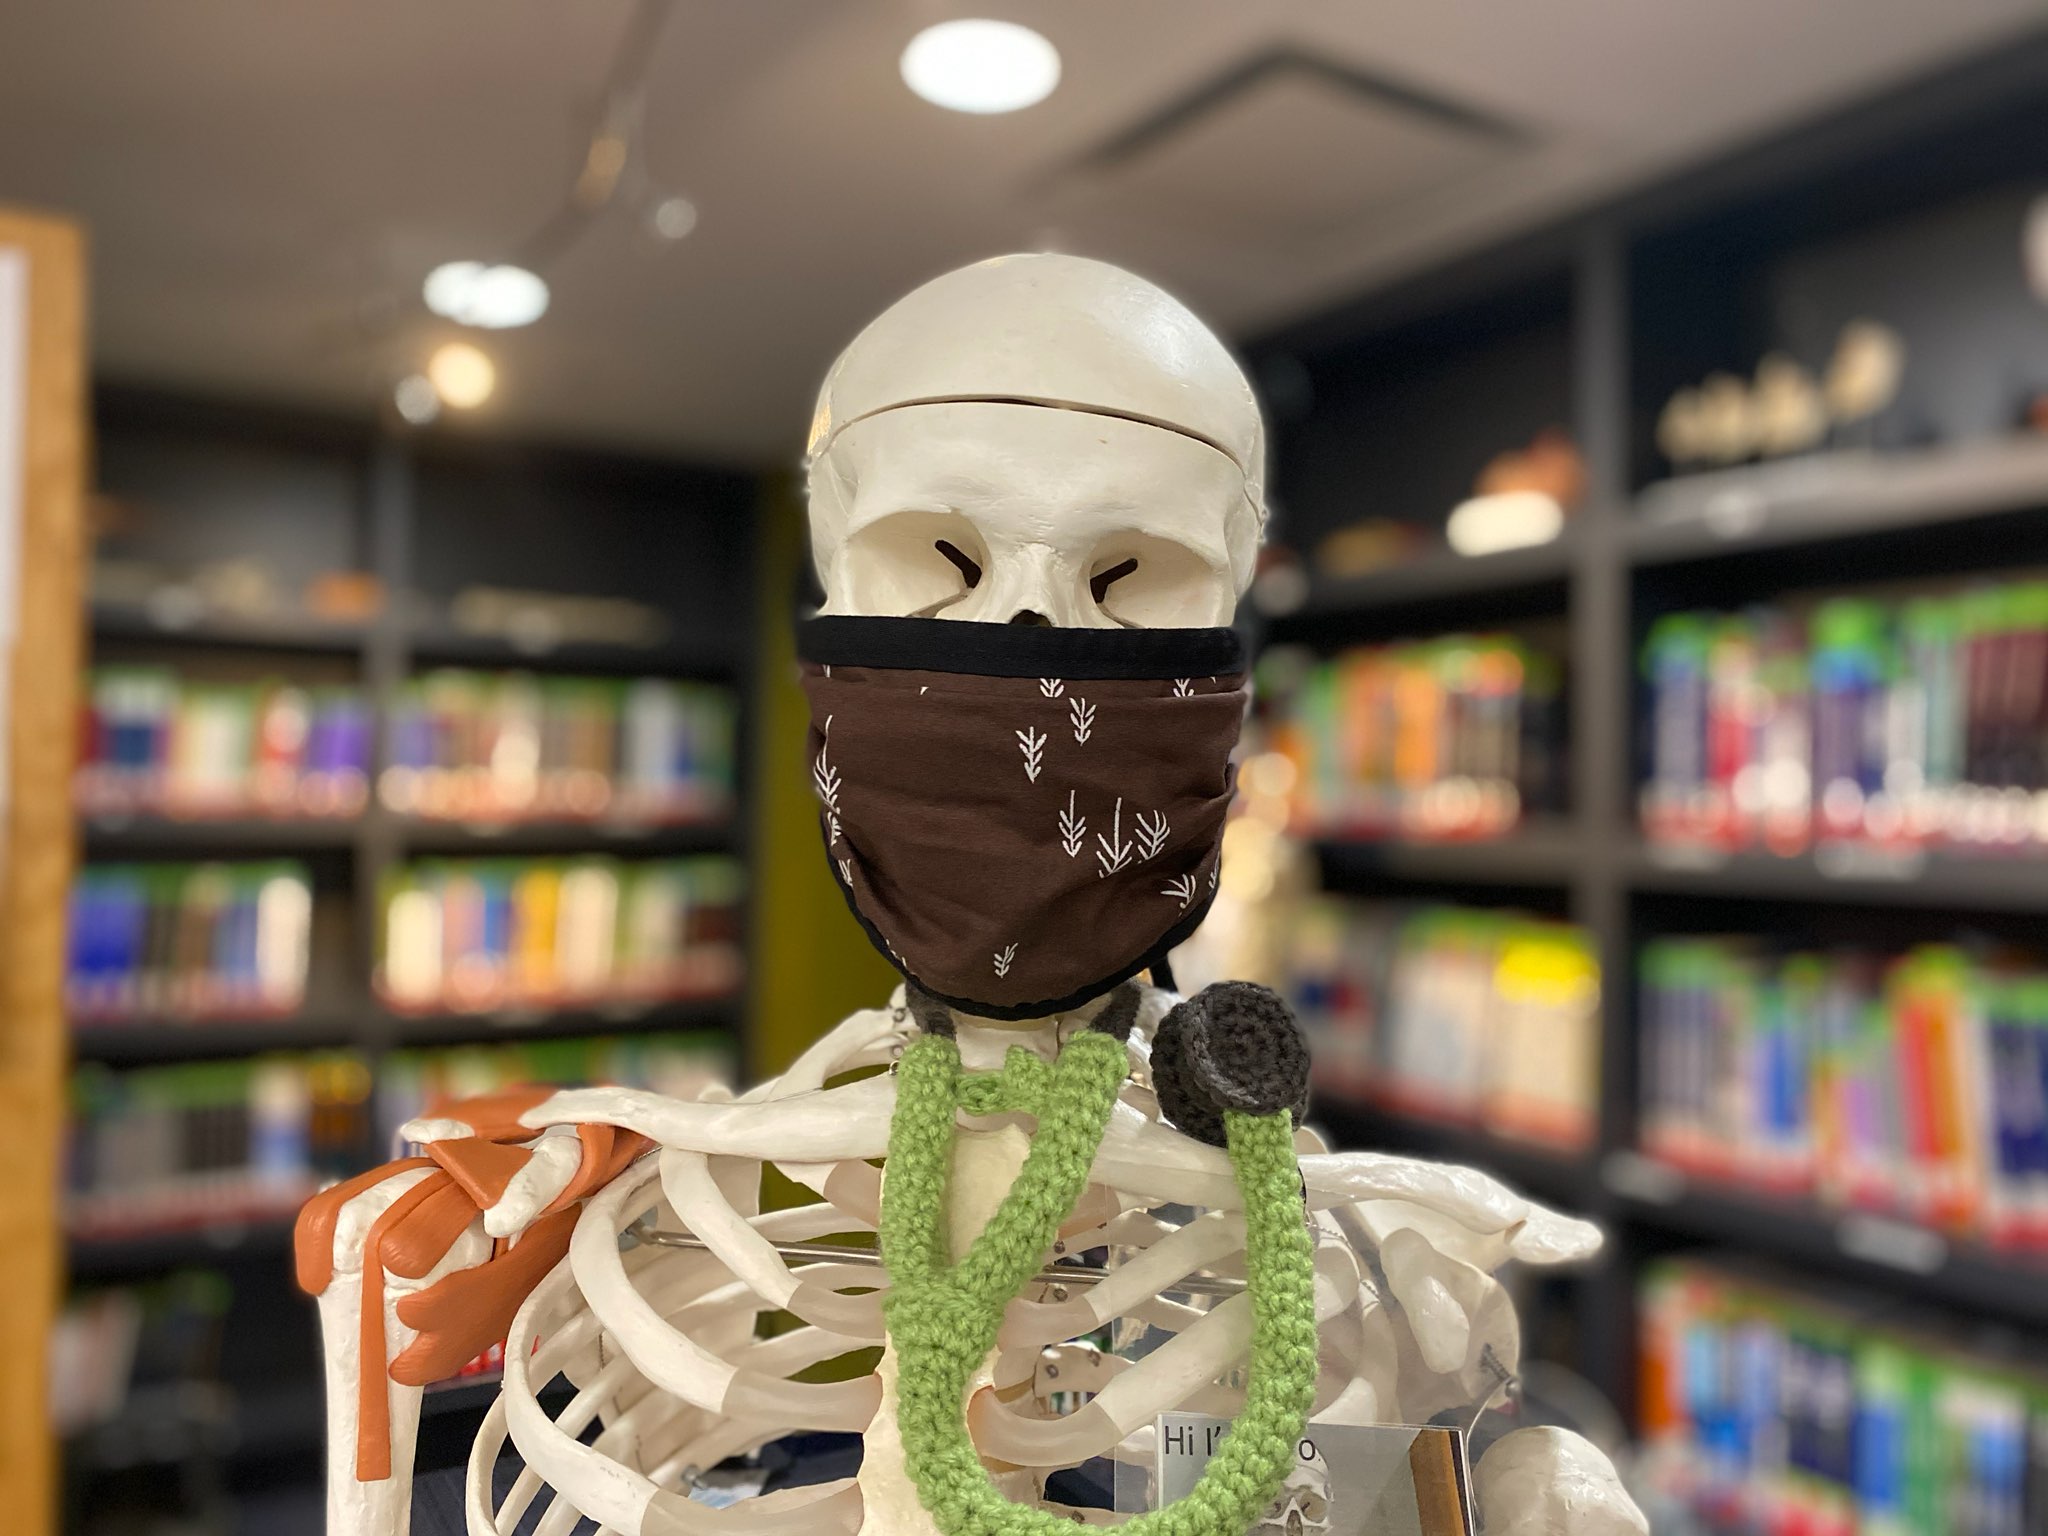
Photo credit: Tarlan Sedeghat
Stay safe everyone,
Tom
Hello hello everyone. It’s about that time again: Affiliation Survey, March 2020 edition!
Twice a year, the Hirsh Health Sciences Library runs the Affiliation Survey, where we walk around and ask every one of our lovely patrons which program they are with (Dental, Medical, PHPD, etc). This is all we ask. We will not ask for your name or even which year you’re in! The numbers we collect are used in aggregate so we can get a snapshot of what the library usage is like. You can take a look at my post from this past December to see how the data turns out.
Here’s how it goes: there are 7 days spread out over the whole month, randomly chosen to try and maximize the usefulness of the numbers (in other words, we’re trying not to get skewed by specific exam blocks too much). On those days, HHSL staff (you’ll probably recognize us!) will walk around 4 times over the course of the day to gather the totals of how many people from each school are in the library. There will be signs and posters up this month, so you’re not caught unaware.
Keep your eyes out for them!
We won’t announce ahead of time which days we’re counting (see our need to randomize, above), so it’s safe to assume that it could just happen any day this month.
Don’t panic!
If you don’t want to be bothered (or to speak out loud), you are welcome to leave your ID next to you while you study. If that is still not good enough, you can write your program down on a piece of paper and leave that next to you. If you’re in a group room, feel free to stick a note to the outside of the door (on the wood – the windows must remain clear!) telling us how many people of what program(s) are in the room. Done and done. We will add that number to our count, and we will move on to the next person!
There are pencils, pens, markers, scrap paper, and tape down at the Service Desk on the 4th floor, so you can even make your sign bright and cheerful! If you have any questions or concerns, let us know either in person at the desk, or through Ask Us on our website. We’re here to help and make this quick and easy.
But otherwise, we look forward to seeing you all next month and finding out just what our beloved HHSL looks like this fine spring.
Good luck on studying and I look forward to seeing you in the library!
Tom
Hi everyone! Happy December. But we are here to talk about October, so…Happy October in Retrospect.
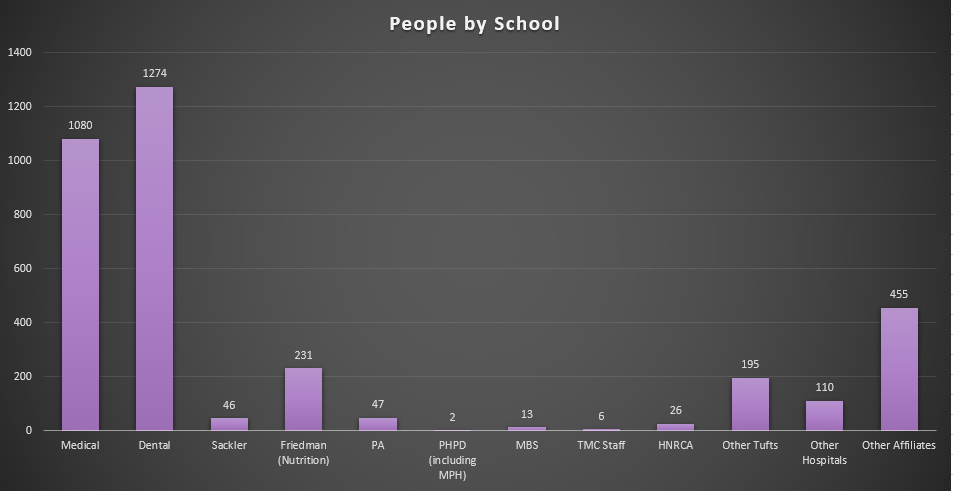
As you may recall, back in October we walked around and asked you all what school you were with. Well, this is the result!
Click to enlarge
We counted a lot of people! I for one am glad you all like us here. A few people have asked me if there were any surprises with this data, but honestly, not really. The Dental school coming in at 1274, Medical coming in at 1080, and Friedman coming in third with 231 is all the sort of thing I am used to seeing in these numbers. Which is not to say it’s bad! It’s actually quite nice to see how consistent we’ve been over the years, especially as we keep adding more and more seating (and subsequently see these numbers grow even larger from time to time).
Now for the unaware, we tend to time this survey so that we get a full week’s worth of data, even if they days themselves are spread out over the course of a month (randomized, with certain accounting for things like Indigenous Peoples’ Day). This is what that “week” ended up looking like this time:
Click to enlarge
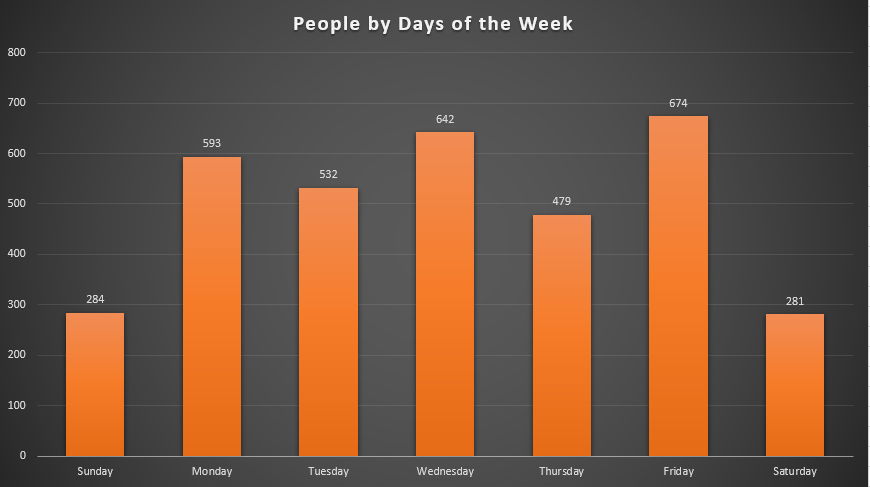
I found this data to be the surprising data. Friday was our busiest day! We counted 674 people on the Friday we did this, and that is astonishing to me. Wednesday being 642 makes sense, and traditionally the busiest day of the week for us tends to alternate between Tuesday, Wednesday, and Thursday, and Saturday being the slowest at 281 sounds right to me. Heck, even Sunday only being 284 seems right. But Friday being the busiest day for counting? I am truly surprised by that.
Naturally, because I am me, I also broke this data up by time of the day and by floor, like so:

Click to enlarge
Click to enlarge
Remember earlier, when I was talking about the school/program breakdown being what I expected? Well, the times and floors are pretty typical of what I see month-to-month with our other data, but this is a great way to take a look at a day in the life of the library. We get crazy busy right around lunch, stay that way through the afternoon, there’s a slight tapering off around dinner, and then then the number of people in the library drops by the final count of the night (in this case, from 959 people at 6pm down to 328 at 3pm).
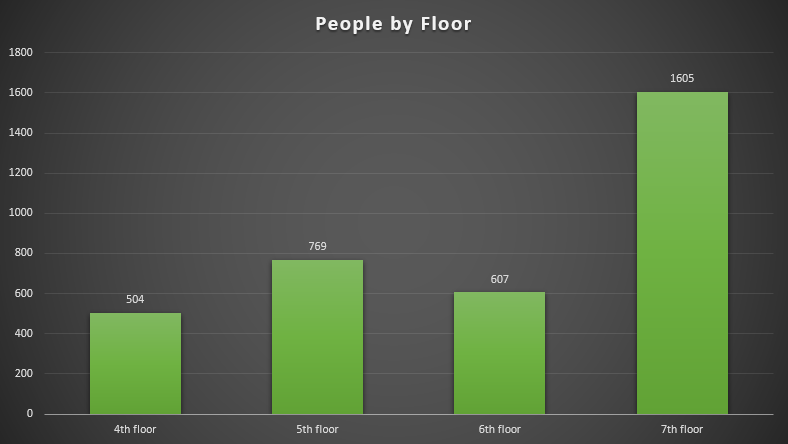
That graph of the floor count is frankly one of my favorite pieces of data in the library. We have been adding so many chairs and so much more furniture over the years the the amount of people on the 7th floor just keeps going up, and as of this past October we were counting over double the amount of people on that floor as any other! Just look at that: the 7th floor had 1605 people counted on it, and the 5th floor came in second at a distance (less than half!) 769 people. That’s nuts. I’m sure it doesn’t surprise anybody who’s been up there, of course, but it’s still nuts.
Click to enlarge
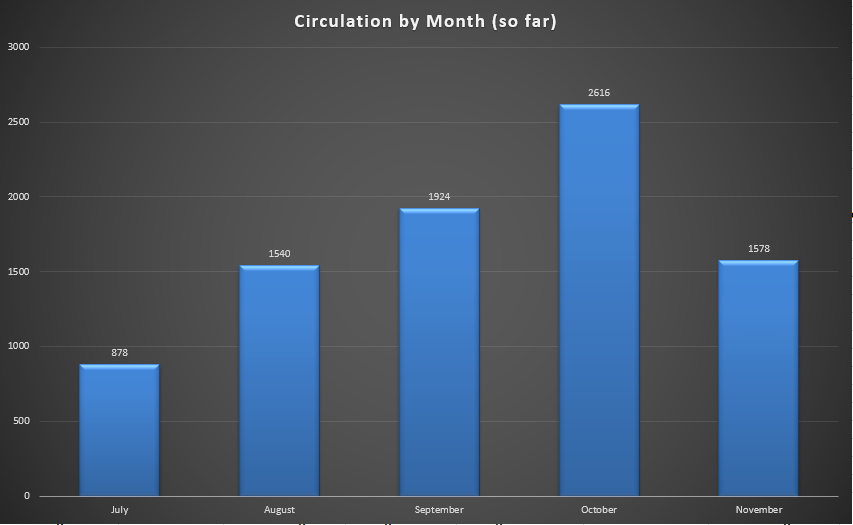
Finally, to bring it all home and give you a spot of context, this graph is the Circulation data from July – November, which as of writing is the most recent data I have. To be clear, it is the number of checkouts per month, not the number of people who have checked things out (because if you check out a skull, a laptop, and a book, that could just be 1 person, but 3 checkouts. See how it works?). October is far and away the most checkouts, at 2616 – September is a relatively distant second at 1924. Given the change in some curricula on campus, I don’t know what to expect for the spring this year – generally, October and April are our busiest months, but time will tell! Hopefully I’ll have some interesting stories from the data come my next summer retrospective.
Well, thank you for reading! I hope this fall brought good things for you, and I hope the winter (and subsequent spring) bring even better! Have a great day everyone, and if you come by the desk on the 4th floor make sure to say hi! I’ll probably be there.
-Tom-
Hello hello everyone. It’s about that time again: time for the Affiliation Survey!
Twice a year, the Hirsh Health Sciences Library runs the Affiliation Survey, where we walk around and ask every one of our lovely patrons which program they are with (Dental, Medical, Sackler, etc). This is all we ask. We will not ask for your name or even which year you’re in! The numbers we collect are used in aggregate so we can get a snapshot of what the library usage is like. The graph you see above is the result of last year’s two Affiliation months, for instance.
Here’s how it goes: there are 7 days spread out over the whole month, randomly chosen to try and maximize the usefulness of the numbers (in other words, we’re trying not to get skewed by specific exam blocks too much). On those days, HHSL staff (you’ll probably recognize us!) will walk around 4 times over the course of the day to gather the totals of how many people from each school are in the library. There will be signs and posters up this month, so you’re not caught unaware.
Keep your eyes out for them!
We won’t announce ahead of time which days we’re counting (see our need to randomize, above), so it’s safe to assume that it could just happen any day this month.
Don’t panic!
If you don’t want to be bothered (or to speak out loud), you are welcome to leave your ID next to you while you study. If that is still not good enough, you can write your program down on a piece of paper and leave that next to you. If you’re in a group room, feel free to stick a note to the outside of the door (on the wood – the windows must remain clear!) telling us how many people of what program(s) are in the room. Done and done. We will add that number to our count, and we will move on to the next person!
There are pencils, pens, markers, scrap paper, and tape down at the Service Desk on the 4th floor, so you can even make your sign bright and cheerful! If you have any questions or concerns, let us know either in person at the desk, or through Ask Us on our website. We’re here to help and make this quick and easy.
But otherwise, we look forward to seeing you all this month and finding out just what our beloved HHSL looks like this fine autumn.
Good luck on studying and I look forward to seeing you in the library!
Tom
Hi everyone,
Time for another installment of my statistics posts! Since the big annual post last June, we’ve changed a little about what we collect, so sadly I don’t have handy available data for which one of our circulation days was the busiest this past year (although I will still be telling you the month). But I can tell you right off the bat that the day we counted the most people studying was November 28th, 2018, when we counted 911 people sitting in our library over the course of the day. 911! That is so many people! Part of it, of course, is all the new seating we keep getting, because we here at Hirsh Library care about where you’re going to sit for your (frankly incredibly long) study sessions. Part of it is probably that we’re just so darn nice.
Leo the Skeleton, winner of my personal secret Nicest Colleague Award, six years running.
Anyway, you are here for some quick bar graphs and neat facts, and far be it from me to keep you from them! First off, here’s a bar graph of the last year’s worth of circulation stats (in blue) and head/seating counts (in red). These can be difficult to compare, since the numbers vary so far from one another (you may notice, for instance, that the circulation stats for a month never go above 3,000, but the seating counts never drop below that number). That is due simply to the digital nature of the schools here nowadays. Many of the students on this campus can stick with their computers, notes, and any textbooks they happen to own, and never really need to come to the desk. Which is a little too bad, given that we have so much stuff for you, but that’s life. What matters here is that heavens to Betsy we had 3,023 checkouts in October! That averages 100 a day, but I can tell you from experience (and I have numbers in past years to back this up) that not all days are created equal. Weekends and holidays are slower, so to make up for those, we would have had single days getting up around the 200 checkout mark. My guess is a Tuesday or Wednesday right before a major anatomy exam.

Click to enlarge.
Now, just because nothing is fun if it lines up properly, October was the busiest month with checkouts (I won’t get into things like questions, consultations, or the sheer volume of EndNote assistance and troubleshooting I have personally offered), but November was actually the busiest month for students in seats, to the tune of 9,274 people counted. Egad! We only have four floors in this building, and the bulk of people (nearly half!) are on the 7th floor.
Incidentally, this seems like a good moment to mention we have foam ear plugs down at the Library Service Desk. They’re free, and you can keep them. We also have headphones you can check out, which cover your ear entirely. Great for blocking noise out!
These graphs always follow the same kinds of patterns, although I was honestly surprised that November took home the gold here. With the Thanksgiving break, it has never been out front like that. But from what I’ve been hearing on the grapevine (….hydrated humerus?), the schools have been shifting their academic schedules around, so I for one will be very interested to see how that effects our numbers.
Speaking of the floors: BAM! Have a chart about the floors. Remember I mentioned how busy the 7th floor is around here? Well I do not make those claims without the numbers to back me up, and hot dang the 7th floor got crazy busy. Particularly -interestingly enough – in January. Why was January the busiest month for the 7th floor? I can answer that the same way I can answer the question “Why do we pay more for the MBTA now but the service has somehow gotten worse?” And that answer is: I don’t know. Magic? Probably magic.
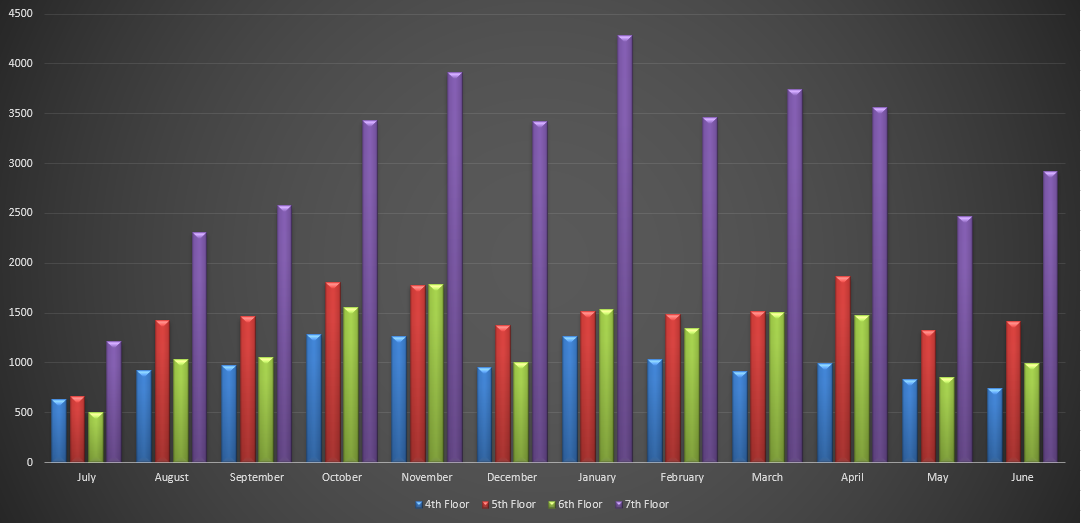
Click to enlarge.
But I do find it cool (hah!) that it happened. I love little mysteries like the January 2019 one. 4,285 people counted on the 7th floor that month, the highest number of people counted on any floor in any month. And I wasn’t kidding about nearly half: that month, the 7th floor accounted for 49.8% of the 8,600 people counted in the library.
I joke around a lot on this blog, but in complete seriousness, I can speak for everyone here at Hirsh when I say: we’re glad you like it here so much, and are willing to spend so much time here. We try very hard to make sure you’re comfortable and have seating and food options for your long study sessions, so these kinds of numbers are good to see. It’s why I collect them in the first place.
Finally, did you know that back in April I wrote a post about the Affiliation Statistics we do here? If you want the full detail I recommend checking that post out, I just want to highlight the day-of-the-week breakdown I did from that post.

Click to enlarge.
You may notice that Monday is the busiest day of October, but Wednesday is the busiest day of March. That kind of thing happens a lot here, and things that seem to effect it are: weather patterns, exam schedules, food specials at the cafe, classes, and whether it’s a holiday week (Indigenous Peoples’ Day in October sometimes has a large effect, and sometimes not). I suspect that there’s also a bit of “I’ve been studying too much lately” and “Oh no Boards are upon me!” also happen, but while we collect all this data, we try very hard to not interrupt your studying.
So, where does this leave us? Well every year is a little different than years prior, and although this gives us a good blueprint for the upcoming year, the desk already feels significantly busier this week than it has in previous Orientation weeks, so there will be some improvisation as well. There always is. But if you’re like me, that’s exciting! Just means more of a challenge.
I hope you all have a great rest of your summers! Welcome back if you’re here, and if you’re not quite yet then make sure you get some beach trips in while you can. Class is around the corner.
And if you’re in the library, make sure to come say hi to me at the Library Service Desk on the 4th floor! I’m here all night.
Statistically yours,
Tom
Hello all, this seems like a good time for a brief round-up of what we learned during the two Affiliation Statistics months this year. If you don’t remember (and how couldn’t you?), those were October and March, when we went around asking you all what programs you happened to be from. It’s always an interesting project when we do it, and I always enjoy showing you some of what we learned.
For instance, the breakdown of days! The way we do the actual survey involves some randomization and scattering around the month, but we make sure to get each day of the week included. In the past, Wednesday has been the busiest day of the week at Hirsh, and that held out in the March count, but in October, Monday was the busiest! There are many different reasons this happens, including class schedules, exam schedules, and even weather patterns. It does help us understand our patron needs, though, which is one more way we can help you all out.
Now, obviously we didn’t go around and ask you about what school you were from just so we could show you this chart of what days of the week are more popular. No, what you may really want to see is the breakdown of which program had the most people here to count, and here you go! The answer…well, probably won’t surprise you, but it’s still fun to look at!
Click to embiggen
Well would you look at that! Medical students and Dental students were the largest population in the library! Unlike past years, it appears there are more MD students studying in the Library, and I have a theory on that: seating. One thing I’ve noticed in the past from other statistics posts and round-ups, particularly when doing the end-of-year, is that our Medical students tend to prefer quiet space for studying. This past year, the Hirsh Library has exponentially increased the amount of available study space on the 7th floor – the quietest of the study floors – and then this happened. That March bar corresponds rather well with 2nd years preparing for their Step exams, too.
Is this a direct causation, or a happenstance correlation? As much as I’d like to say it’s causation, I’m cautious about claiming that. Then again, as the movie Field of Dreams once said, “Build it and they will come.” So who knows!
For the record, we’ve also recorded a drop-off for PA, PHPD, and MBS from October to March. But we’re seeing people from the other Tufts programs and all our various other affiliates here in larger numbers. Remember that everybody in the Tufts Community is welcome here all the same! Hirsh is for all of you.
Now the best way to see how good my guess about the extra study space is, of course, is to do something like, say, look at which floors were the busiest. But I’d have to have all that data handy and be able to put it in a totally different chart.
Good. News.
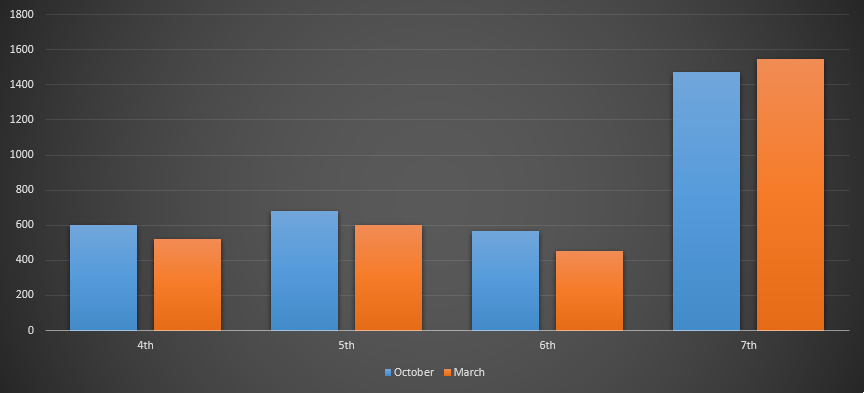
Click to en-full-size-en
Okay. Full disclosure: I always knew it would look like this. The 7th floor is crazy popular. We collect data year-round (which I will be discussing in a post a few months from now, for an end-of-year wrap-up), and one thing I have noticed is that the 7th floor is consistently twice the populous of any other floor. Twice! Which makes sense when you stop and think about it: it’s got the most of all kinds of study space, and is somehow still the quietest floor of the lot.
I think I speak for everyone here when I say: I’m glad you like it so much!
That’s all for now. Good luck with the remainder of your exams, and I’ll see you back here this summer for the big wrap up, when I talk about some interesting numbers (like busiest days) and how this year stacks up against years past!
-Tom-
Hello hello!
March is upon us, which means the time has come for our second (and final) Affiliation Survey this academic year! What does this mean for you? Well, this is that time when we walk around and ask every one of our lovely patrons which program they are with (Dental, Medical, Sackler, etc). This is all we ask. We will not ask for your name or even which year you’re in! The numbers we collect are used in aggregate so we can get a snapshot of what the library usage is like.
This post from this past June shows you just what all the numbers ends up looking like.
Now here’s how it goes: there are 7 days spread out over the whole month, randomly chosen to try and maximize the usefulness of the numbers (in other words, we’re trying not to get skewed by exam blocks too much). On those days, HHSL staff (you’ll probably recognize us!) will walk around 4 times over the course of the day to gather the totals of how many people from each school are in the library. There will be signs and posters up this month, so you’re not caught unaware.
Keep your eyes out for them!
We won’t announce ahead of time which days we’re counting (see our need to randomize, above), so it’s safe to assume that it could just happen any day this month.
Don’t panic!
If you don’t want to be bothered (or to speak out loud), you are welcome to leave your ID next to you while you study. If that is still not good enough, you can write your program down on a piece of paper and leave that next to you. If you’re in a group room, feel free to stick a note to the outside of the door (on the wood – the windows must remain clear!) telling us how many people of what program(s) are in the room. Done and done. We will add that number to our count, and we will move on to the next person!
There are pencils, pens, markers, scrap paper, and tape down at the Service Desk on the 4th floor, so you can even make your sign bright and cheerful! If you have any questions or concerns, let us know either in person at the desk, or through Ask Us on our website. We’re here to help and make this quick and easy.
But otherwise, we look forward to seeing you all this month and finding out just what our beloved HHSL looks like this fine autumn.
Good luck on studying and I look forward to seeing you in the library!
Tom
Follow Us!


